The core idea
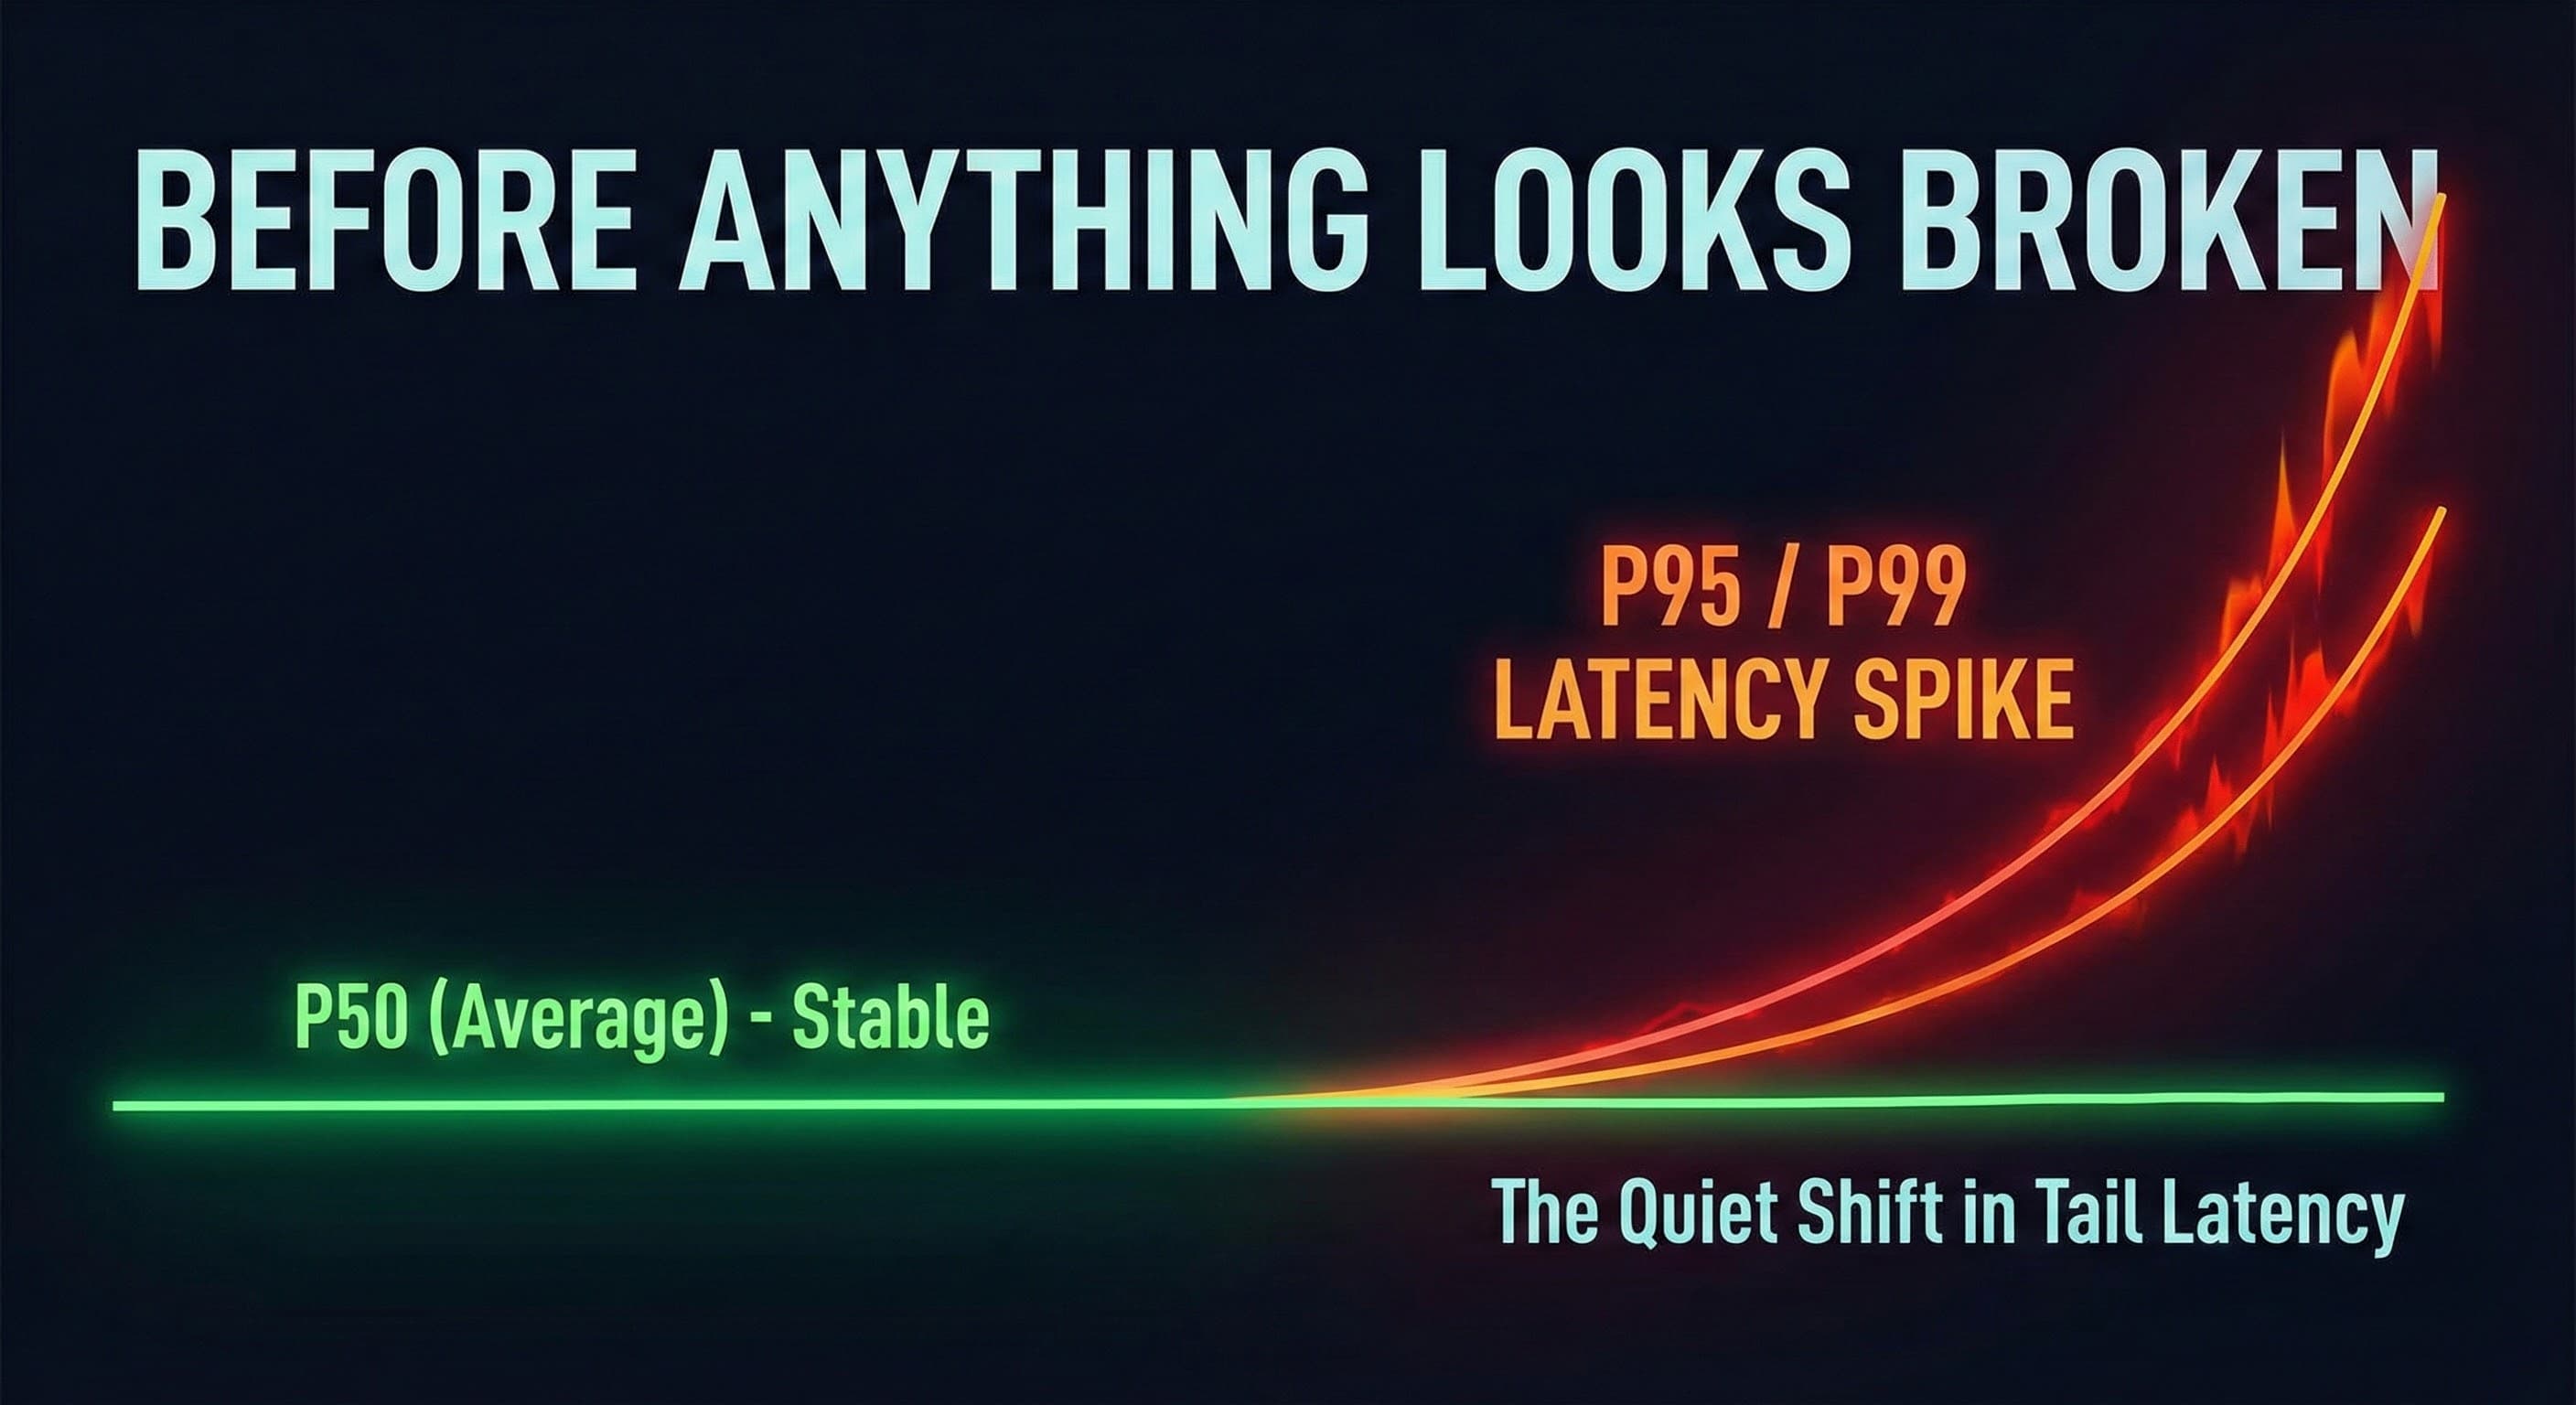
Averages can stay stable while the product feels slower — because growth pain shows up in the tail.
There’s a moment almost every growing product hits. Your dashboards look normal. Average latency hasn’t changed much. And yet… users start saying the product feels slower.
It’s not one dramatic outage. It’s not a clean regression. It’s a creeping degradation that shows up as “random slowness,” “weird delays,” and “it used to feel snappier.”
Teams respond like they always do: optimize. They ship a fix, deploy it, check the dashboard… and the average looks basically the same. Weeks go by, and eventually you learn one of the most expensive lessons in scaling: Average latency is lying.
Context
Part of the Growth series: Performance Problems Are Growth Problems . Growth doesn't just increase traffic — it changes system behavior. The mean stays calm while the tail breaks.
The comforting trap of “the average looks fine”
Averages are seductive because they feel like stability. One number makes the world easy to reason about: “Most things are okay.”
And early on, that’s often true. When traffic is predictable and dependencies are few, systems behave in a way that is… averageable.
But growth changes the shape of reality. You don’t simply get more requests — you get more variance: burstier usage, uneven workloads, more contention, and more dependency noise.
Averages only work when reality is uniform. Growth makes reality uneven.
Averages don’t describe experience. They describe frequency.
Average latency is dominated by your fastest, most common requests. If most requests are fast, the mean will mostly reflect that.
That means “bad moments” — the ones users remember — can grow dramatically while the average barely moves. You can make 5× more people miserable and the dashboard can still tell you “everything’s normal.”
Your system can be statistically fine and experientially terrible.
A simple story: “same system, worse experience”
Before growth, most requests take ~100ms. A small fraction are slow. It’s annoying, but rare. After growth, the same endpoint still looks fast most of the time — but now a larger fraction falls into “slow territory” because pools exhaust, contention rises, and queues form under bursty load.
To the dashboard, the system looks similar. To customers, it becomes unreliable. That’s why users describe performance problems emotionally: “It’s inconsistent.” “Sometimes it’s just stuck.” “It’s fine… until it isn’t.”
They’re not talking about the average. They’re describing the tail.
The tail is where growth shows up first
Most growth-related performance problems begin in the tail because the tail is where constraints reveal themselves. The slowest requests happen when the system is pressured: queues form, locks fight, pools deplete, dependencies spike, fanout multiplies latency.
These aren’t “bugs” in the traditional sense. They’re system behaviors under stress — and they often affect only a subset of requests at first. That’s why averages hide them.
Averages don’t just hide pain — they hide the bottleneck
The more dangerous consequence of relying on averages is that they hide where time is actually going. Most bottlenecks don’t punish every request equally. They punish a specific endpoint, a cohort with heavier workflows, one dependency, one contention point.
Those requests pile up in the slowest percentile. If you only track the mean, you chase the wrong improvements: optimize frontend while backend is queueing, add caching while the real issue is contention, scale infra while the bottleneck is a lock.
That’s how performance work becomes expensive: lots of effort, little movement.
So what should you measure instead?
You don’t need a more complex dashboard. You need a more honest one.
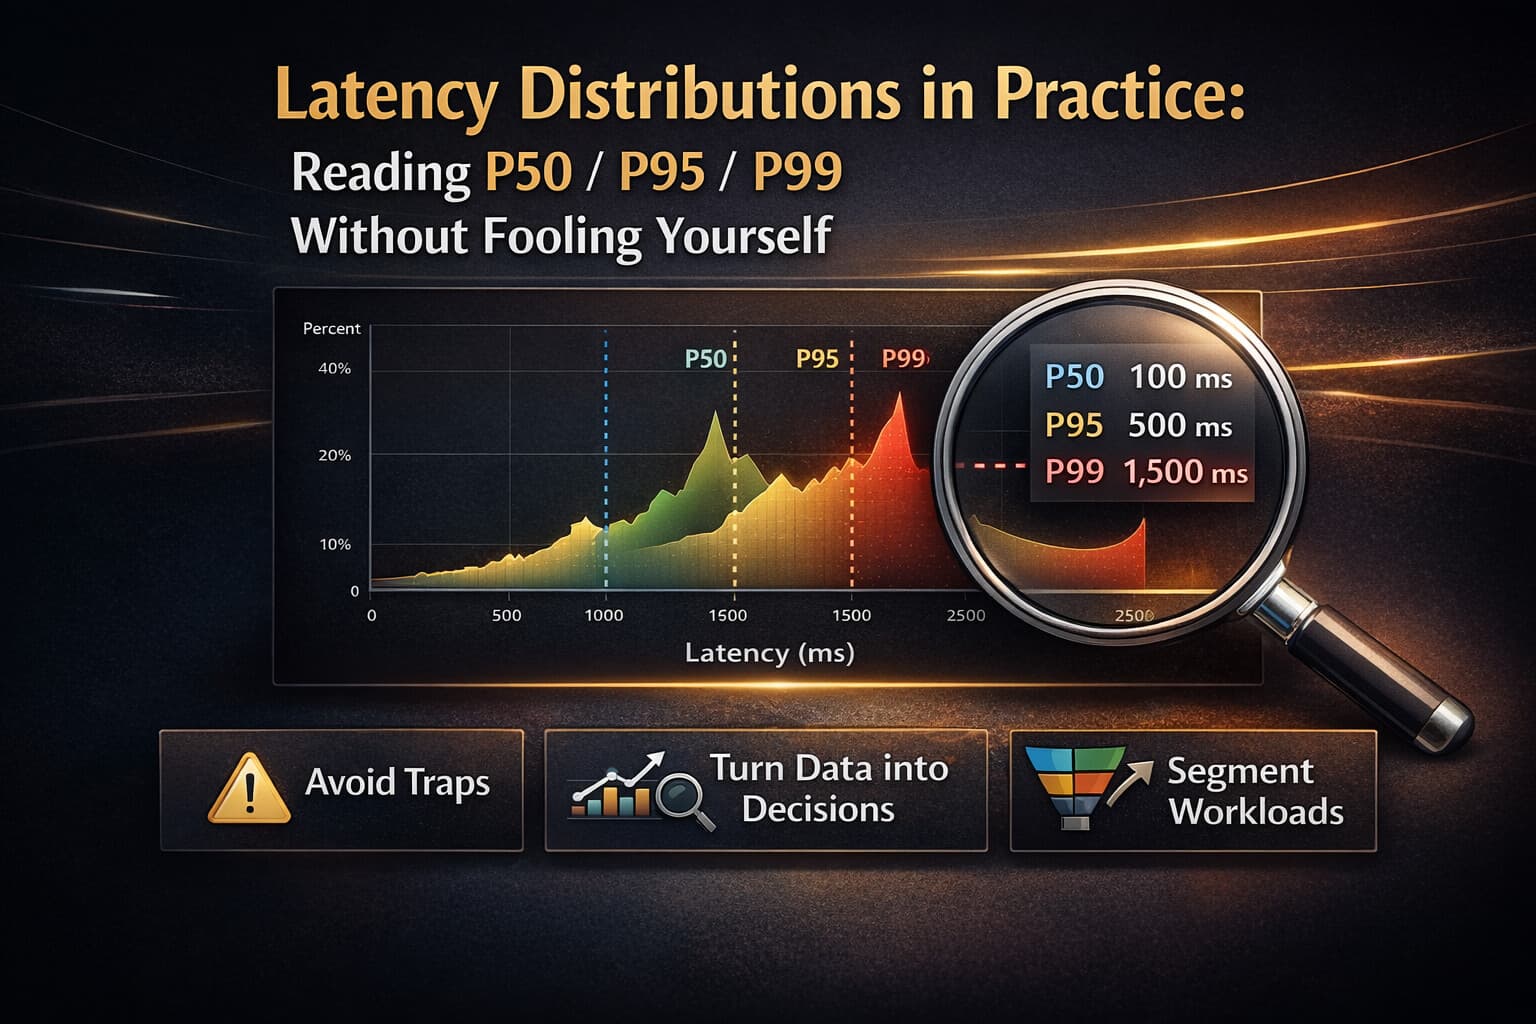
If you want a signal that tracks experience as you grow, look at distributions: what is typical (P50), what is frustrating (P95), and where trust breaks (P99).
The median tells you what happens to most. The tail tells you what happens when the system is pressured. Growth lives in pressure.
The no-guesswork way to stop being fooled
You don’t fix this by staring harder at charts. You fix it by asking a better question: Where is the slowest 1% spending time — and why?
Once you investigate the tail directly, performance stops being a vague argument and becomes diagnosis. That’s the difference between tuning and engineering.
If you want a practical workflow for that, the next cluster post will cover the exact pattern: tail sampling → tracing the critical path → classifying the constraint → validating before/after. (Link will be added once published.)
What to read next
If your product is scaling and you’re seeing “random slowness,” these are the next best steps:
Continue the Growth series
Explore the Growth hub: Growth .
It shows the repeatable loop: baseline → isolate → fix → validate → prevent regressions.
Final takeaway
If you’re scaling and still using average latency as your primary health signal, you’re driving by looking in the rear-view mirror.
Averages tell you what happens most of the time. Growth pain lives at the edges. And your customers experience the edges.
Measure the tail. Understand the constraint. Validate improvements with distributions. That's how performance stops being a surprise — and becomes something your growth strategy can rely on.
FAQ
Questions readers usually ask next
Why do averages hide performance problems?
Averages are dominated by the fastest, most common requests. When growth increases variance (burstiness, contention, queueing), the slowest requests get worse but represent a smaller fraction of total requests, so the average stays stable while users experience degradation.
What should I measure instead of average latency?
Measure distributions: P50 (median), P95 (95th percentile), and P99 (99th percentile). P50 tells you what happens to most users, while P95/P99 shows what happens when the system is pressured — which is where growth pain shows up first.
Why does tail latency get worse first during growth?
Tail latency reveals constraints: queueing, contention, pool exhaustion, dependency variance. As traffic grows, more requests hit these constraints, stretching the tail while the average remains stable because most requests still follow the fast path.
If this sounds familiar…
Users complain, conversion softens, and the team can't explain it — because the mean hides the signal.
What changes when you scale
Variance increases. Systems become uneven. Tail latency becomes the experience customers remember.
Want a bottleneck map?
If your dashboards are green but the product feels slower, start with a 7-day baseline audit. We map tail latency drivers and isolate the constraint — without tuning loops. Get an AI system audit.
Last updated
December 30, 2025