Thesis
Performance problems aren’t random bugs. They’re the system telling you: growth has changed your operating conditions.
When a product grows, the system doesn’t just get “bigger.” It gets different: new traffic shapes, deeper dependency chains, more data, more releases — and more ways to fail. That’s why performance issues often show up exactly when things are going well.
This pillar is a practical framework for founders, engineering leaders, and system owners who want to fix performance without guessing — and keep it fixed as they scale.
Who this is for (and who it's not)
This is for teams where latency and reliability affect revenue, retention, or support load — and where leaders want outcomes they can trust: P95/P99, error rates, throughput, and cost per request.
It’s not a generic performance tips post, and it’s not a substitute for evidence-based diagnosis.
Why growth creates performance issues
Early systems feel fast because the happy path dominates. Growth flips the assumptions. You don’t just get more requests — you get more of the hard parts:
- Burstiness: peaks get sharper
- Tail latency: P95/P99 becomes the experience
- Contention: locks, hot keys, and queue buildup
- Saturation: CPU / IO / network / pools hit limits
- Coordination overhead: more services, releases, and regressions
The most common mistake
When performance becomes painful, leaders tend to reach for one of two defaults:
- “Let engineering optimize.” That becomes endless tuning and debate.
- “Just scale infra.” That buys time, then costs explode — and the bottleneck returns.
At scale, performance is rarely a single bug. It’s usually a constraint in the system: data access, contention, dependency latency, execution boundaries, or queueing pressure.
What it looks like in the real world
Performance failures usually start quietly — as signals that are easy to dismiss:
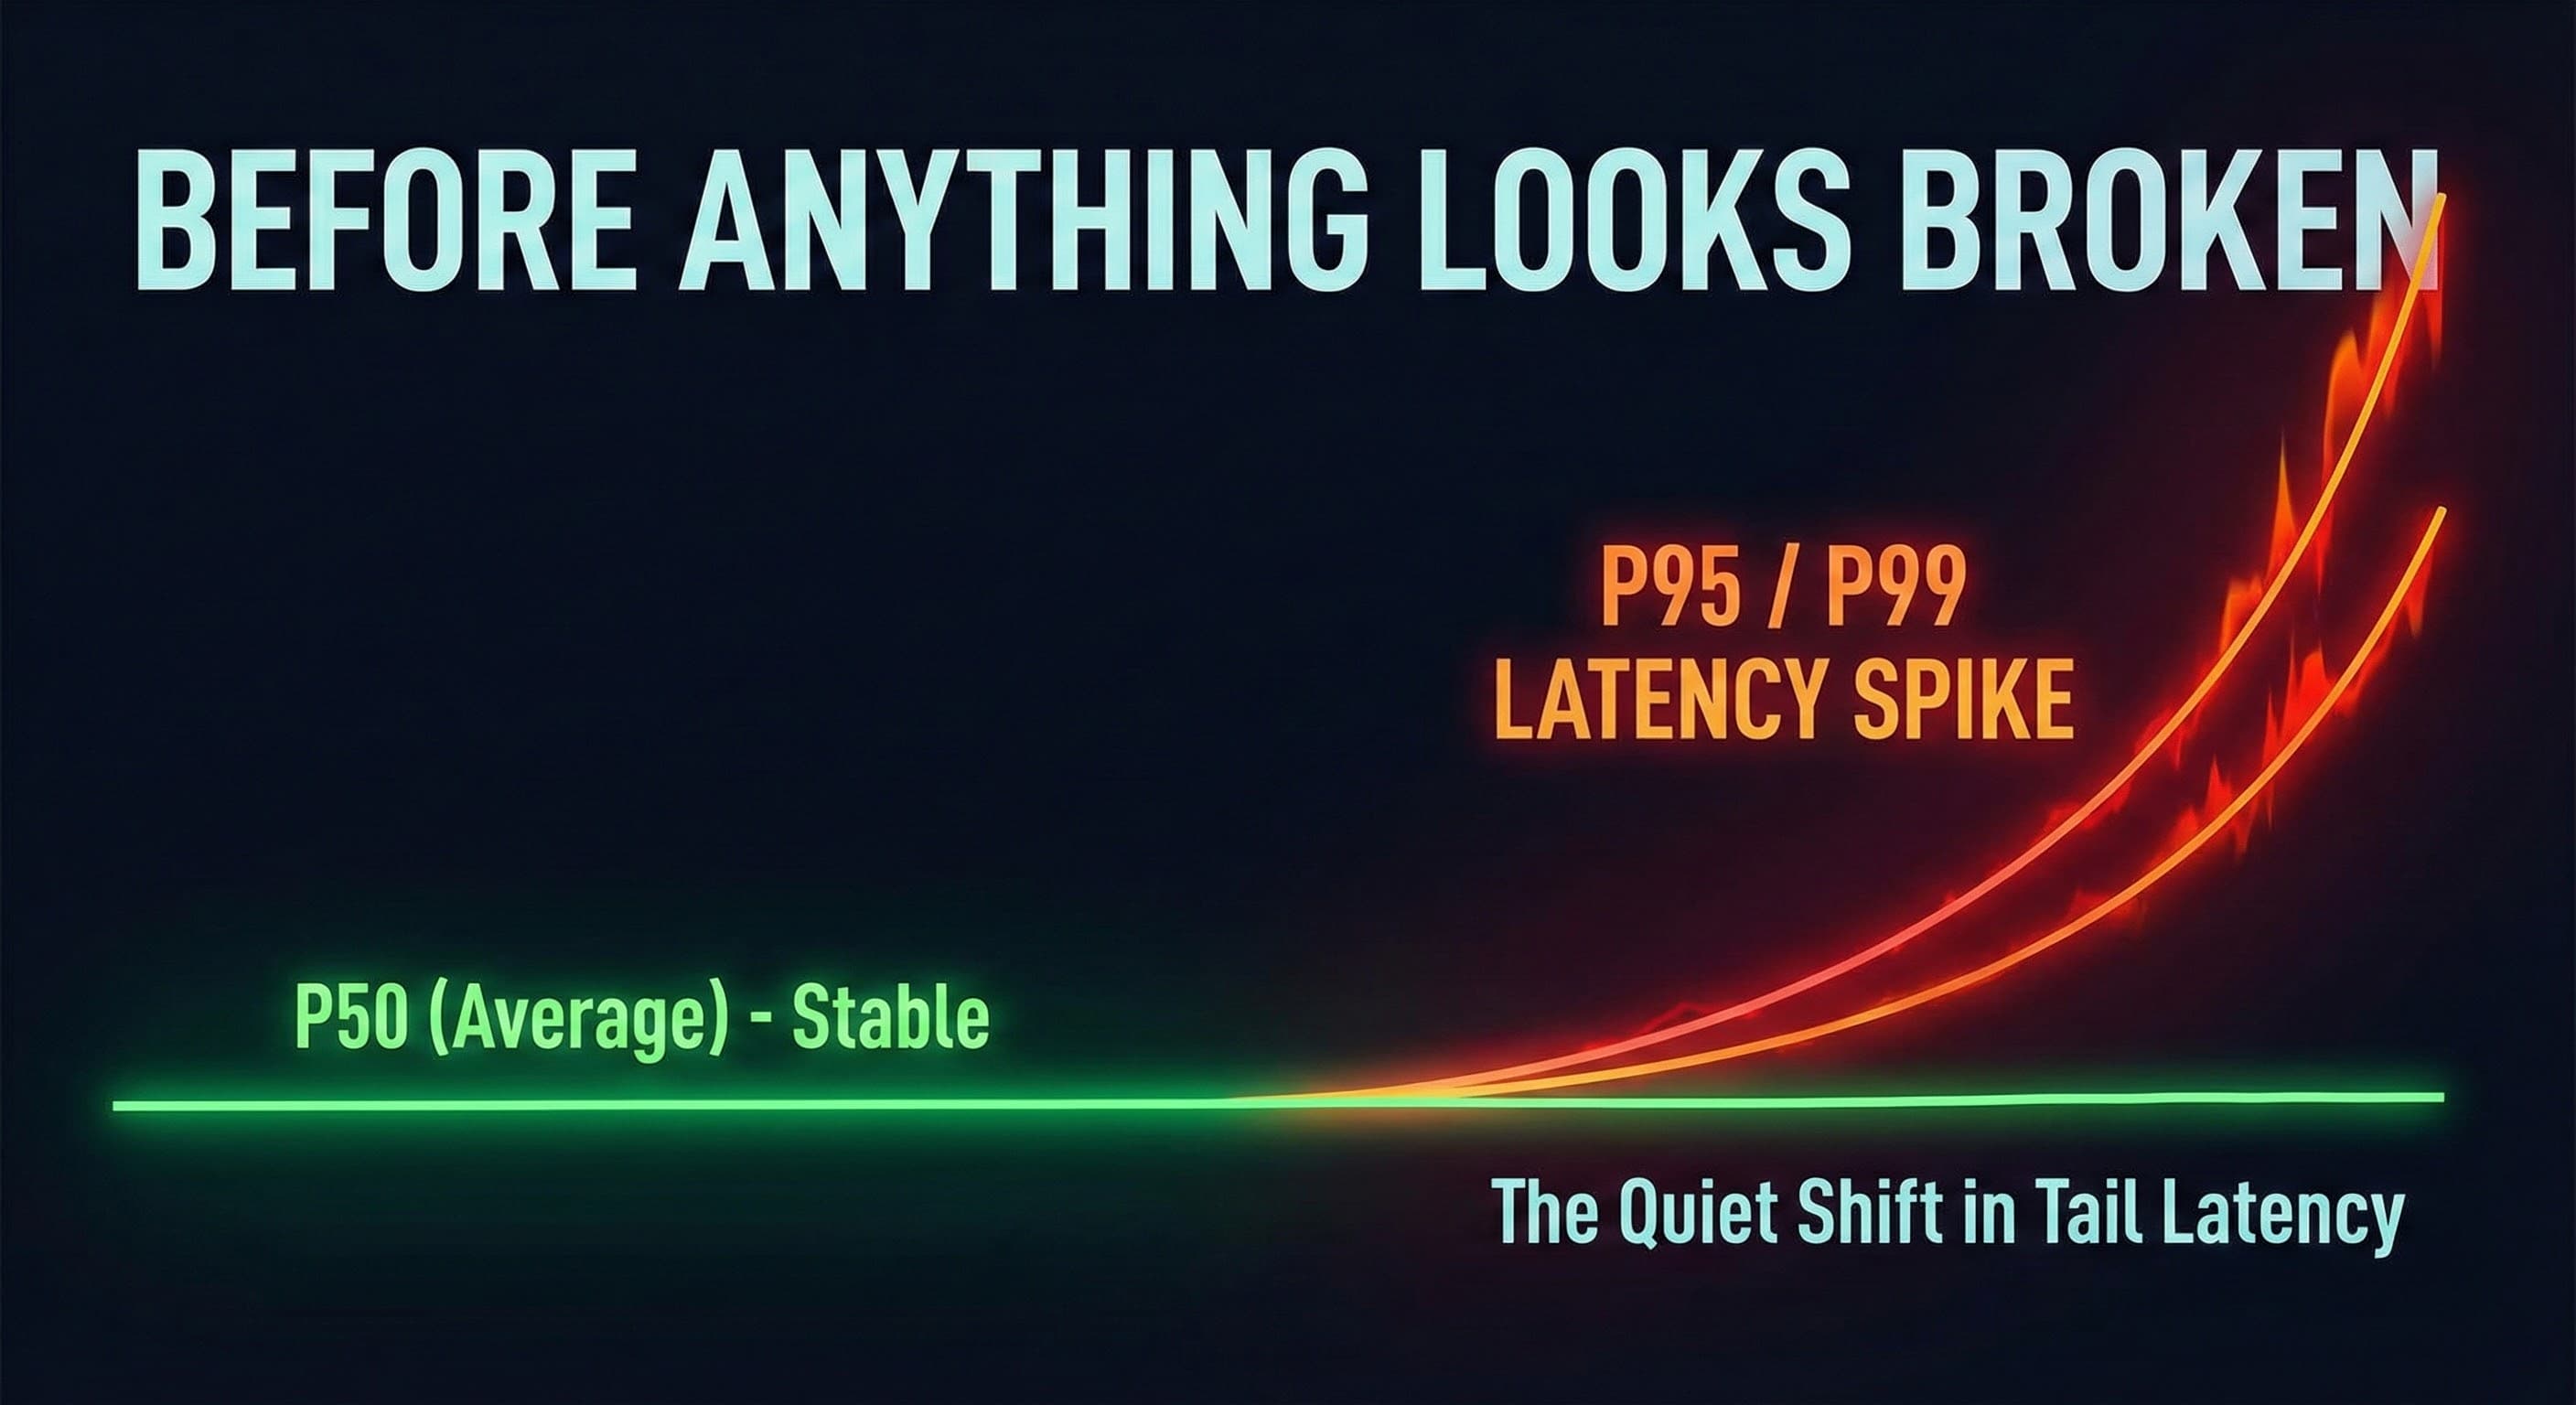
- Averages look fine, users complain (tail pain is invisible)
- P95/P99 gets worse first (growth hits the tail before dashboards scream)
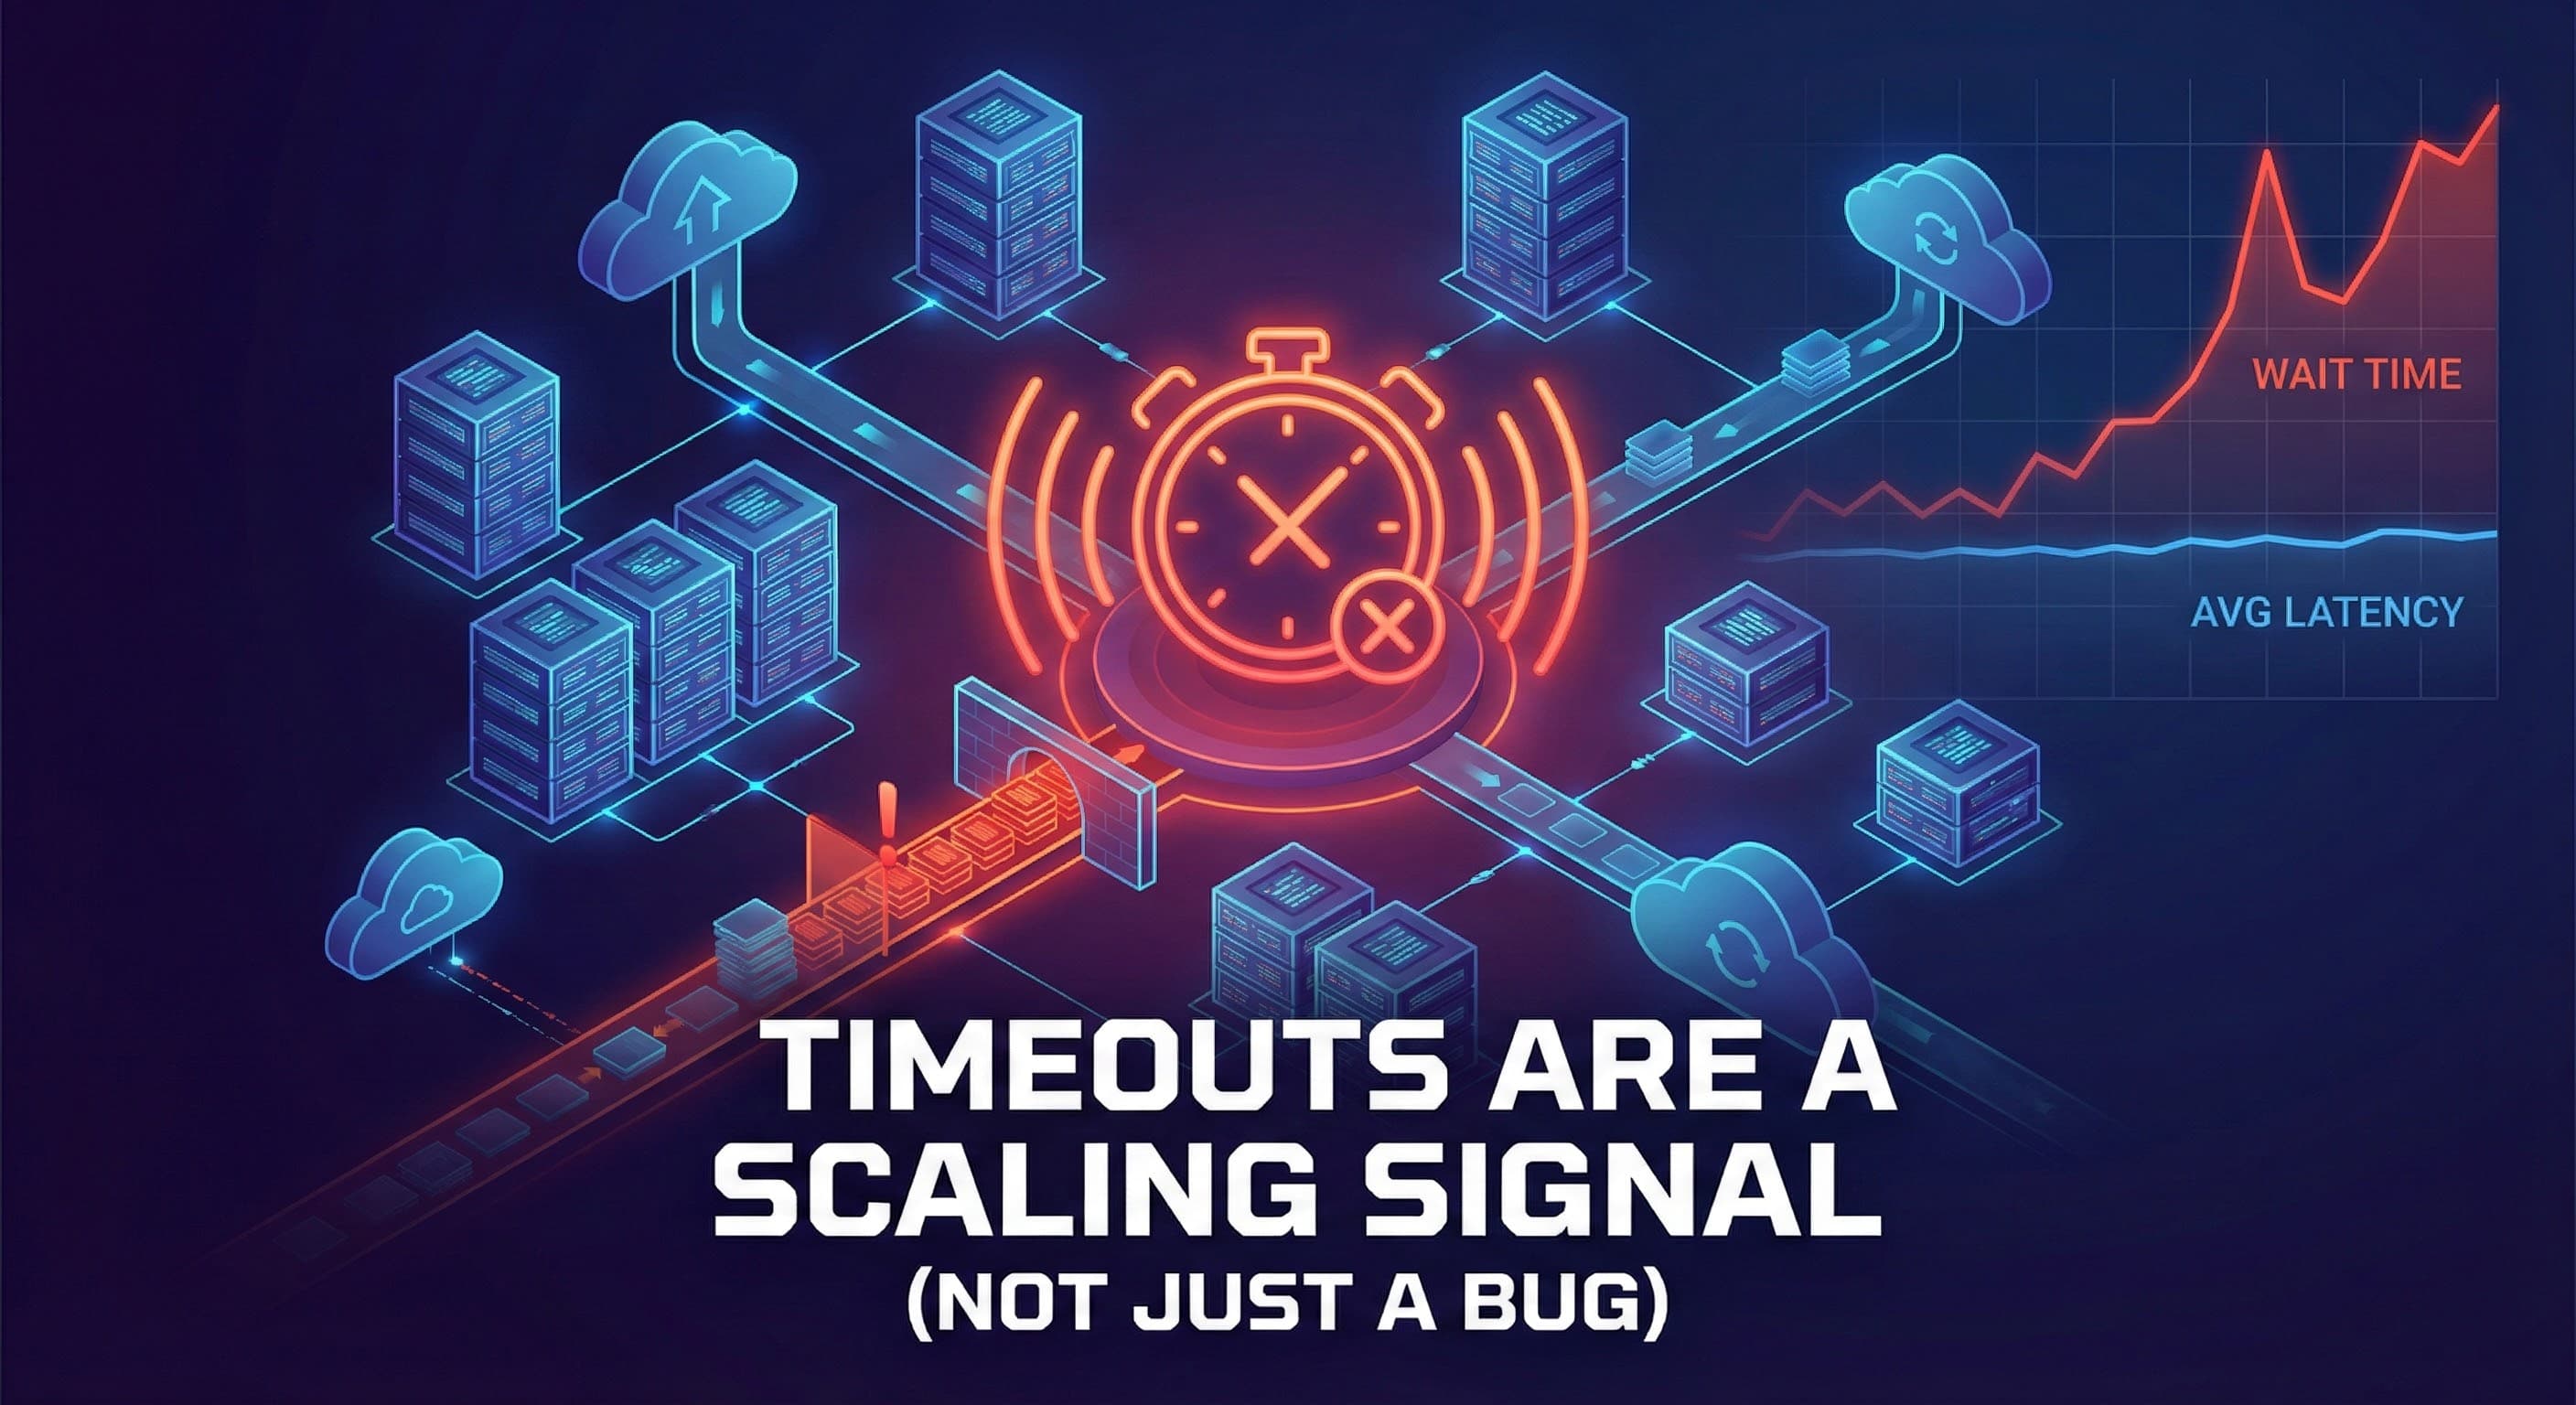
- Timeouts feel random (queueing + saturation)
- Costs climb faster than speed improves (you’re paying to delay the constraint)
Why this becomes a business problem
Performance isn’t just “engineering quality.” It becomes a business outcome problem:
- Customer experience: slow critical flows reduce conversion and increase churn
- Cost: guessing creates overprovisioning + engineering thrash
- Team speed: uncertainty slows shipping and increases coordination overhead
- Trust: customers lose confidence, and leaders lose predictability
The core truth: performance is a bottleneck problem
At scale, speed comes from removing the dominant constraint — not from making everything a little faster. The goal isn’t to optimize 100 things. It’s to find the 1 bottleneck that dominates under real load.
This is also why “just add servers” feels like it works… until it doesn’t. When the system is waiting — on pools, locks, retries, queue depth, or downstream latency — more CPU doesn’t remove the constraint. It just gives you a bigger room to wait inside.
Here’s a real example: a long-running e-commerce store was “mostly fine” on normal days, but peak sales turned into checkout timeouts, 5xx spikes, and war-room operations. The team kept scaling servers every season — and every season the pain returned. The bottleneck wasn’t raw compute. It was a constraint chain: legacy runtime behavior, query inefficiency under accumulated data, and infrastructure quality under sustained load. We validated it with distributions and constraint signals, modernized execution and data, and peak traffic became stable and predictable. (Full case study here.)
Leader rule: If you can’t explain why a fix should move P95/P99, you’re probably guessing.
The No-Guesswork Framework
The goal is not heroic optimization. The goal is a repeatable loop: baseline reality, isolate the constraint, remove it, validate impact, and prevent regressions — then run the loop as the product grows.
A practical decision tree for leaders
- Users complain but dashboards look fine → you’re missing tail signals. Start with P95/P99 + saturation.
- P95/P99 rising + cost rising → you’re paying to delay the bottleneck. Start with isolation signals (pool wait, locks, queue depth).
- Timeouts increasing → queues/saturation are building. Start with dependency latency + retry behavior + backlog.
- Incidents after releases → regressions. Start with validation + performance budgets.
Definition of done
Performance work only counts if leaders can trust it and teams can repeat it. “Done” looks like:
- P95/P99 improves (not just averages)
- Error/timeout rates drop under comparable load
- Cost per request stabilizes or improves
- The bottleneck is explained with evidence (traces + constraint signals)
- Regression controls exist (budgets, release checks, alerts)
What you should get out of performance work
A no-guesswork engagement should produce artifacts you can use:
- a baseline performance report (P50/P95/P99, errors, saturation)
- bottleneck isolation with evidence (traces + constraint signals)
- a prioritized plan (quick wins + structural moves)
- validated before/after results
- optional governance so improvements stick
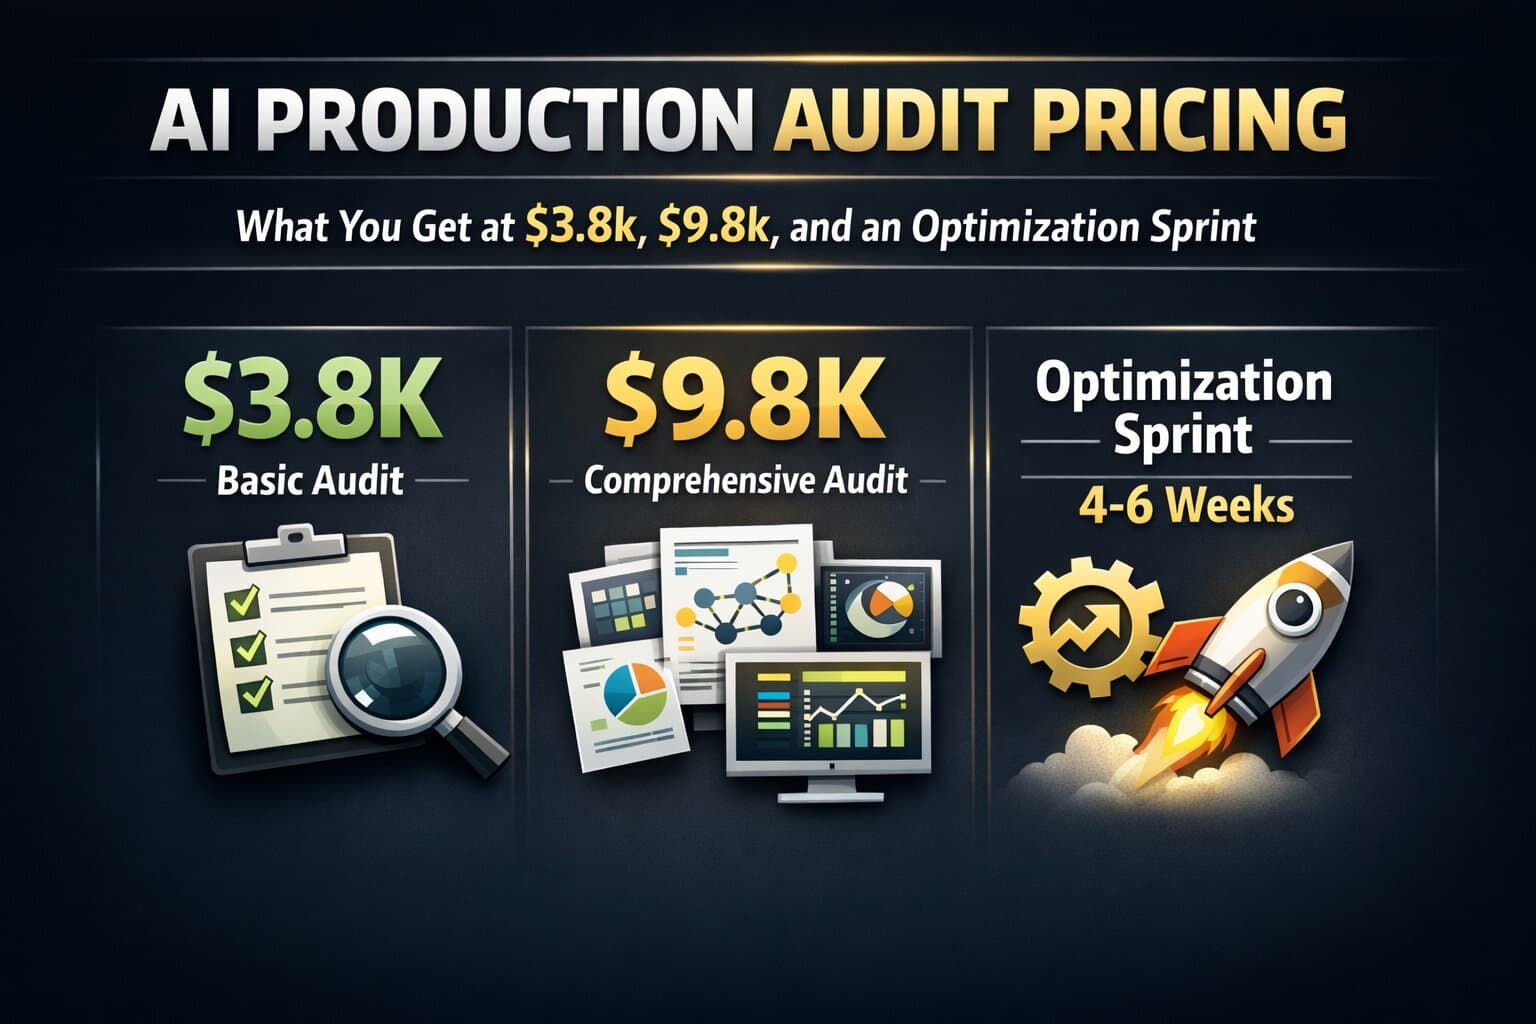
Start fast: a 7-day baseline audit
If you’re already feeling growth pain, a 7-day baseline audit gives you a bottleneck map and a prioritized plan — without months of tuning. The audit tells you what’s limiting the system. Optimization removes that limit. Governance keeps it from coming back.
Recommended next reads
If you want to go deeper, these are the most useful follow-ups depending on what you’re seeing:
Final note: make performance repeatable
The goal isn’t to win one optimization. The goal is to build a system: detect constraints early, remove them with evidence, validate outcomes, and prevent regressions as you ship and scale.
Because when growth changes your system, performance becomes part of your growth strategy.
Baseline (define reality)
Capture production distributions (P50/P95/P99), errors, saturation signals, and critical paths. Output: a baseline report + top drivers.
Isolate (find the constraint)
Use metrics + traces + profiles to identify queueing, contention, dependency latency, and execution boundaries. Output: “this is the bottleneck and here’s the evidence.”
Fix (choose the right move)
Remove the constraint with the right lever: caching, batching, async, backpressure, query changes, fanout reduction, or redesign a hot path.
Validate (prove the improvement)
Show before/after distributions, cost delta, and error impact under comparable conditions. Output: results you can ship and defend.
Keep it fixed (prevent regressions)
Create performance budgets, release validation, and monitoring that catches regressions early. Output: a system, not a one-time win.
Leadership
- Who owns performance?
- Why performance becomes team conflict
FAQ
Questions readers usually ask next
Why do performance problems appear after growth?
Because growth changes traffic shape, tail latency, contention, saturation, and coordination overhead. System behavior shifts — so bottlenecks emerge under real operating conditions.
Why don't averages reflect real user experience?
Averages hide tail latency. Users experience the slowest P95/P99 requests, which worsen first under load, contention, and queueing.
What is the No-Guesswork Framework?
A repeatable loop: baseline reality, isolate the constraint, fix the bottleneck, validate impact, and prevent regressions with governance so improvements stick.
This is for you if…
- Users complain but dashboards look green
- P95/P99 is rising and incidents feel “random”
- Costs keep climbing but speed doesn’t improve
- Performance turns into debate and tuning loops
This is not…
- Generic performance tips
- A “just cache it” checklist
- A one-time tuning sprint
- A substitute for evidence-based diagnosis
If you want a bottleneck map fast
Start with a 7-day baseline audit: production distributions, bottleneck isolation, and a prioritized plan with before/after validation. See more about our audit.
Last updated
January 3, 2026