Latency breaks in layers
Slow assistants are usually a stack problem: pre-output work, queueing, and bad timeout policy interacting under load.
An AI assistant can look healthy in demos and still feel slow in production. The reason is usually not "the model is slow." At scale, latency breaks across a chain: TTFT gets worse, queues start forming, and timeout budgets get consumed in the wrong place.
If you measure only one end-to-end latency number, you collapse three different problems into one graph. For production assistants, that is how teams end up adding bigger instances, raising timeouts, and still shipping a worse user experience. This guide gives you a practical model for diagnosing where the time goes and which fixes actually move P95/P99.
The practical model
Assistant latency = pre-work (retrieval, prompt assembly, admission) + TTFT + generation / tools + waiting. At scale, the part that grows fastest is usually waiting.
If your team is already dealing with slow chat UX, timeouts, or throughput ceilings, the broader playbook lives in the latency and serving hub . For the buyer-visible symptom, see high P95 latency in LLM systems .
Why AI assistants feel fast in staging and slow in production
Staging traffic is clean. Production traffic is not. Real users create burstiness, mixed prompt sizes, long-tail context lengths, noisy tenants, background jobs, and dependency variance. Those factors make assistant latency nonlinear under load.
What changes first in production
- Context length distribution widens: long prompts and large retrieved context increase prefill cost
- Concurrency rises: model workers, tool executors, and retrievers start queueing
- Tail-heavy requests dominate perception: a few very slow conversations break trust faster than a stable median helps it
- Retries add ghost traffic: clients, gateways, and tool layers multiply load exactly when the system is weakest
This is why "works on test traffic" tells you very little about a production assistant. The interesting question is: what happens to TTFT and queue wait when concurrency, context, and tool variance increase together?
TTFT is the first budget users notice
In a chat interface, users usually feel time to first token before they care about total completion time. A 5-second answer that starts streaming in 400ms feels very different from a 5-second answer that stays blank for 3 seconds.
TTFT usually includes more than the model
- request routing and admission
- retrieval, reranking, and context assembly
- tool planning and policy checks
- model queue wait and prefill
- cold starts or cache misses
That is why TTFT is such a useful diagnostic metric. If TTFT gets worse while decode speed stays flat, your problem often sits before useful output starts: retrieval latency, long context prefill, queueing for model capacity, or slow tool setup.
A useful split
Measure TTFT and time to complete separately. TTFT explains perceived responsiveness. Completion time explains total work. Without both, teams often blame the model for delays caused by admission, retrieval, or queueing.
Where queueing hides in AI assistant stacks
AI assistant teams often think of queueing as "a message broker problem." In practice, the most expensive queues are hidden inside the request path.
- Model admission queues: requests waiting for an inference worker, replica, or provider slot
- Retriever and reranker pools: too few workers or expensive top-k / rerank paths
- Tool-call executors: CRM, search, billing, or workflow tools with rate limits and variable latency
- Connection pools: vector DB, Redis, SQL, HTTP client pool exhaustion
- Gateway concurrency limits: per-tenant or global rate shaping that turns into wait time
- Streaming fan-out: many open streams pin resources longer than request-per-response dashboards reveal
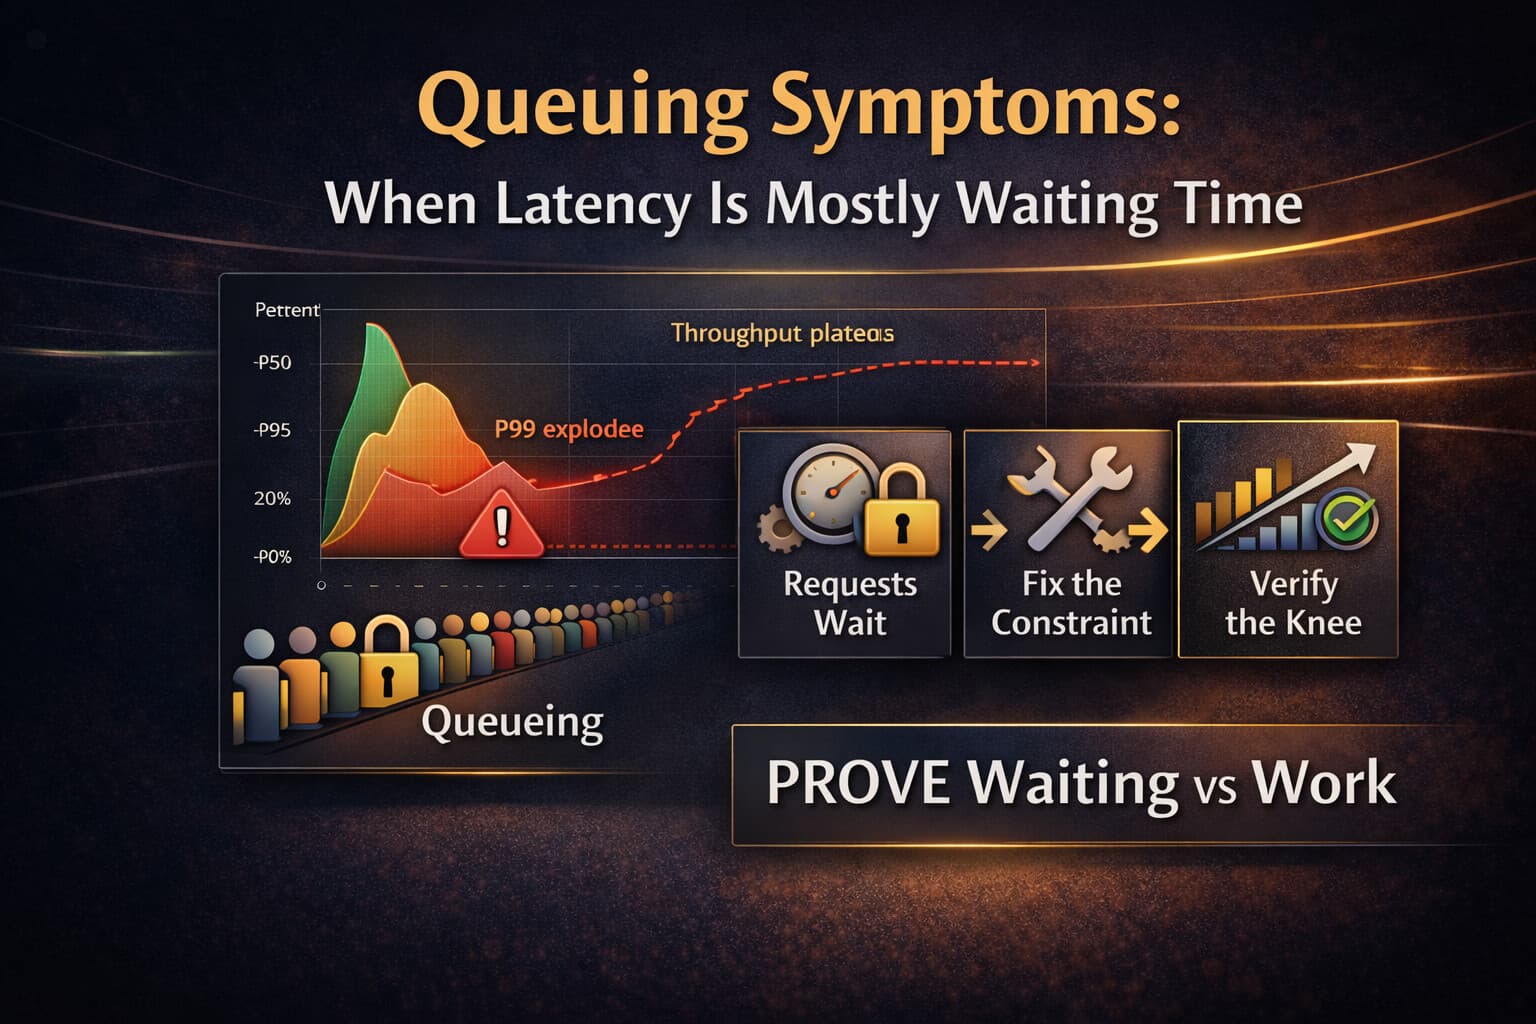
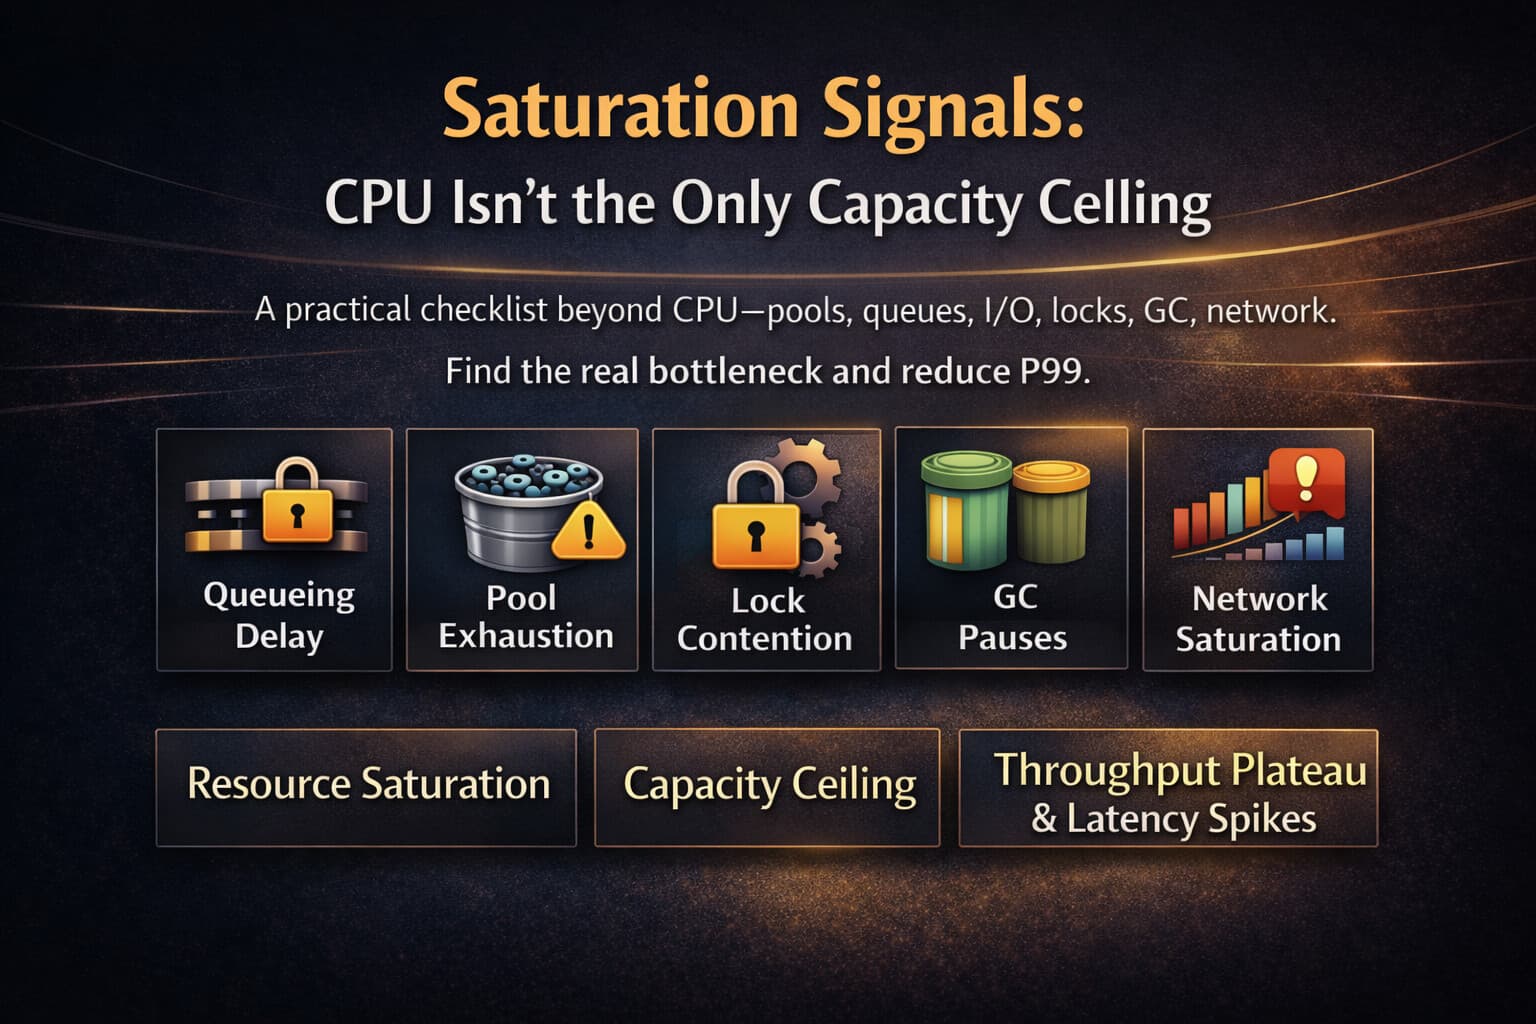
The queue you need to fix is usually the first waiting point on the critical path. If you want the general diagnostic workflow, read queueing symptoms and saturation signals .
Timeout budgets are policy, not just config
Timeout budgets are where many assistant stacks quietly fail. Teams set a 30-second frontend timeout, then give retrieval 10 seconds, reranking 10 seconds, tools 15 seconds, and the model 30 seconds. That is not a budget. That is overlapping wishful thinking.
What a real timeout budget does
- Starts with user-visible patience: what delay is still acceptable for this workflow?
- Allocates time by stage: retrieval, prompt build, admission, generation, tools, post-processing
- Leaves slack for variance: network jitter, provider variance, slow cohorts
- Enforces cancellation: if upstream budget is burned, downstream work should stop
- Controls retries: a retry must fit inside the remaining budget or be rejected
In AI systems, bad timeout design creates a dangerous feedback loop: a request waits in queue, reaches the model late, times out at the edge, retries, and adds more load to the same saturated path. The result is not only slower UX but lower throughput.
A timeout is often queueing plus bad policy, not just one slow dependency.
A symptom map: TTFT spike, full timeout, or both?
Different latency shapes imply different bottlenecks. Use the symptom first, then prove it with traces and stage-level metrics.
TTFT rises, total time rises the same amount
Usually points to pre-output waiting: retrieval slowdown, model admission queues, long context prefill, or cold starts. Streaming won't save this if nothing useful starts quickly.
TTFT stable, total time rises a lot
Usually points to long generation or tool execution: verbose outputs, looped tool plans, slow downstream APIs, or post-processing work.
TTFT and timeout rate both rise under load
Strongly suggests queueing plus budget collapse. Requests wait longer to start, consume more of the budget before generation begins, then hit downstream timeouts or retry storms.
Median looks fine, P95/P99 get ugly
This is classic tail-first degradation. One tenant, one prompt shape, one tool path, or one provider region is often much slower than the rest. Segment before you guess.
The 20-minute triage: what to check first
Before changing prompts, models, or instance size, run a short triage that answers one question: where is the first significant wait?
- Split the latency: TTFT, time-to-complete, timeout rate, retry rate.
- Segment the bad cohort: route, tenant, model, region, tool path, context length.
- Trace one critical flow: retrieval, rerank, prompt build, model wait, generation, tools.
- Look for one waiting metric: queue depth, model admission wait, pool acquire wait, tool backlog, provider throttling.
- Check timeout policy: which stage is consuming the budget, and are retries violating the remaining budget?
- Apply one reversible mitigation: cap concurrency, reduce fan-out, shed non-critical tools, or shorten context for the affected cohort.
If the reversible mitigation quickly improves TTFT or P99, you probably confirmed queueing rather than "the model just got slower."
Fix patterns ranked by leverage
The right fix depends on whether the dominant problem is wait time, work per request, or bad policy. In practice, the best order is: control admission, reduce unnecessary work, design better budgets, then add capacity.
1) Reduce wait before adding hardware
- bound concurrency per model / tenant / dependency
- add bounded queues and fail fast instead of letting waits grow invisibly
- separate interactive traffic from batch or background generation
- protect critical flows with bulkheads and per-tool limits
2) Reduce pre-output work to improve TTFT
- trim context and reduce prefill cost
- cache retrieval and rerank results for repeated patterns
- skip expensive tool planning on simple intents
- keep warm capacity for latency-sensitive assistants
3) Make timeout budgets explicit
- set an end-to-end user budget and allocate stage budgets inside it
- cancel downstream work when the remaining budget is insufficient
- cap retries and backoff within remaining budget only
- define fallbacks: shorter context, smaller model, tool skip, partial answer, or graceful failure
4) Add capacity only after the constraint is clear
Scaling inference replicas can help, but only if the real bottleneck is model admission and not retrieval, tool execution, throttling, or unbounded retries. Otherwise you just move the queue or pay more to keep the same tail latency.
For a real before/after example, see cutting P95 latency in a RAG pipeline . For trace-backed diagnosis, see tracing the real bottleneck end to end .
Verification: prove the assistant got faster
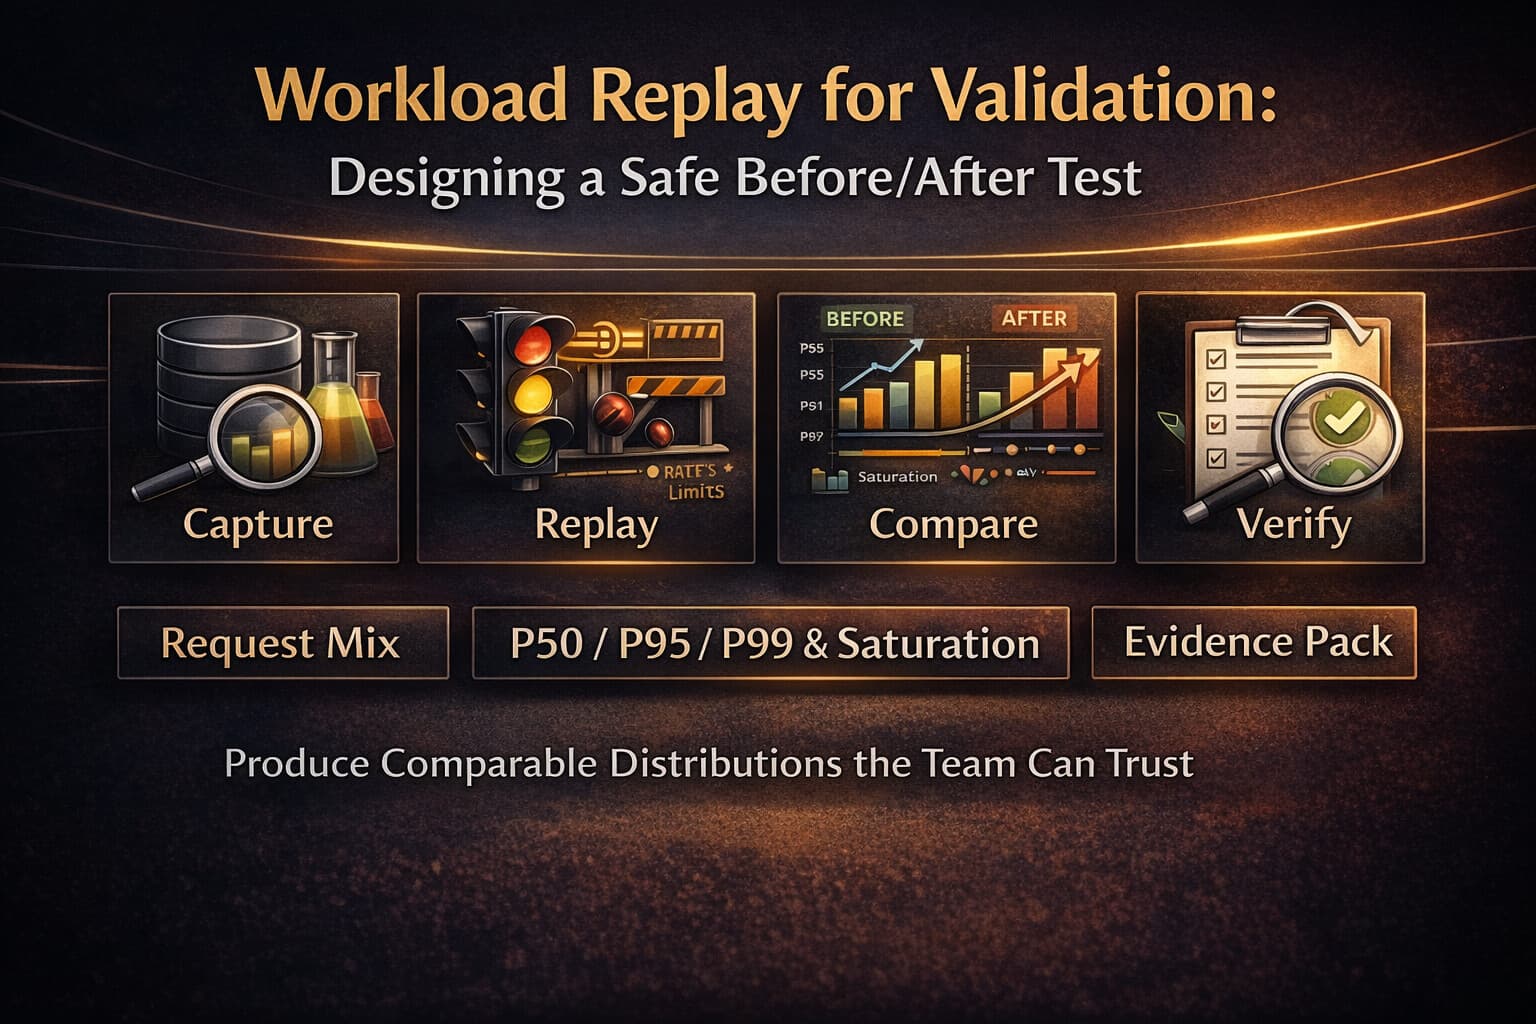
Most teams stop at "it seems better." That is not enough. Assistant latency work should produce an evidence pack that survives the next traffic spike.
Verification checklist
- Same cohort: compare the same route, tenant tier, model, and context band
- Stage-level improvement: TTFT, queue wait, and completion time improve where expected
- Tail improvement: P95/P99 and timeout rate improve, not only averages
- Stable throughput: no hidden gain from serving fewer requests
- Retry discipline: retry rate and cancellation behavior improve under load
- Guardrails: dashboards and alerts exist for TTFT, queue wait, and timeout burn
Audit-first context
If your team cannot cleanly separate TTFT, waiting time, generation time, and timeout policy, you are operating with blended latency. That usually means you need structured diagnosis before tuning. Start with a production audit or move into a verified optimization sprint .
When to escalate to a full audit
You should escalate when:
- TTFT is high but you cannot tell whether the delay is retrieval, admission, or model prefill
- timeouts rise only at peak, and reproducing the problem safely is hard
- multiple queues interact across retrieval, tools, and model serving
- retries or fallbacks may be hiding the real bottleneck while inflating cost
- you need a prioritized fix plan with before/after validation, not a list of guesses
When that happens, the goal is not "tune the prompt." The goal is to build a stage-level baseline, isolate the first queue, repair timeout policy, and verify the knee moved right.
Next reads
FAQ
Questions readers usually ask next
What is TTFT in an AI assistant?
TTFT means time to first token. It is the time from request start until the assistant begins streaming useful output. TTFT includes upstream work such as retrieval, prompt assembly, admission to the model, and prefill. It is often the first latency metric users feel in chat UX.
Why does an AI assistant get slower under load even when average latency looks fine?
Because AI assistant latency usually breaks in the tail first. Averages can stay stable while P95/P99 worsen due to queueing at model workers, retrieval bottlenecks, tool-call variance, or retry amplification. Users experience the slow edge cases even when dashboards look calm.
How should timeout budgets be set for LLM or RAG systems?
Start with a user-visible end-to-end budget, then allocate portions to each stage: retrieval, reranking, prompt assembly, model admission, generation, tool calls, and post-processing. Leave slack for network variance and avoid giving every dependency the full request timeout. Budgets should be enforced with cancellation and bounded retries.
What's the fastest way to diagnose whether the slowdown is TTFT, queueing, or generation time?
Trace one critical assistant flow and break latency into stages. Compare median and tail requests. If TTFT is high before tokens start, suspect retrieval, model admission, or queueing. If TTFT is normal but total time is long, suspect long generation, tool loops, or downstream work. Then correlate the slow stage with a matching saturation or error signal.
TTFT is user-facing
If nothing useful appears quickly, the assistant feels slow even when total completion is acceptable.
Queues hide everywhere
Model slots, retrievers, rerankers, tool executors, and provider limits all create waiting time before errors become obvious.
Budgets need enforcement
A timeout budget only works if cancellations, retries, and fallbacks respect the remaining time.
Verify by cohort
Compare the same route, tenant, model, and context band before claiming the assistant is faster.
Need a stage-level latency map?
If TTFT, queue wait, and timeout policy are blended into one slow-number dashboard, start with a structured baseline. Audit first.
Last updated
March 19, 2026