Queueing is waiting time
If P50 is stable but P95/P99 widen, suspect queueing: pool acquire waits, lock waits, backlog, throttling — not "slow code."
Many "performance issues" are not slow code — they're queues. Requests spend most of their time waiting: waiting for a DB connection, a worker slot, a lock, disk I/O, or a downstream dependency. That's why P99 can explode while CPU looks normal.
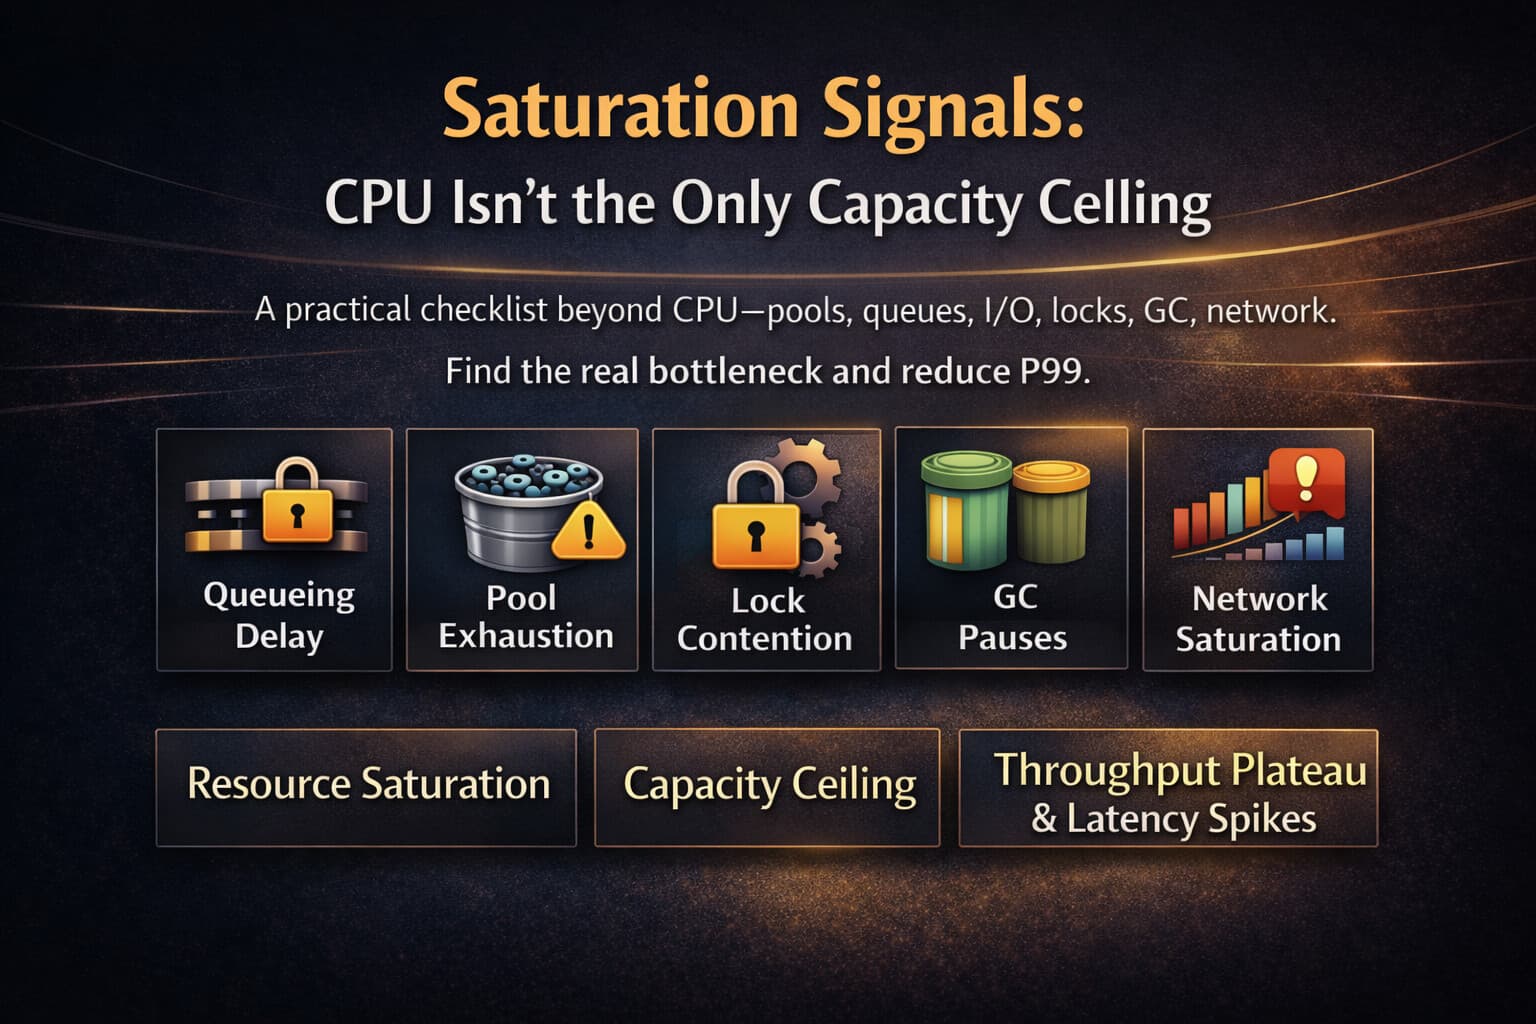
This playbook helps you spot queueing latency symptoms, locate where the queue forms, and prove whether the tail is mostly waiting time. If you want the full end-to-end workflow, start with finding the constraint chain . And if you're hunting ceilings beyond CPU (pools, locks, I/O, quotas), read saturation signals .
The simplest mental model
Latency = service time (doing work) + wait time (queueing). Most tail latency blow-ups are wait time.
What queueing looks like (and why the tail explodes)
Queueing has a distinct signature: as load approaches capacity, waiting time grows nonlinearly. Small increases in demand or small slowdowns can cause large increases in P95/P99 latency.
The most common chart pattern
- P50 stays relatively stable, but P95/P99 widen (tail-first degradation)
- Throughput plateaus even as you add replicas/workers
- Timeouts and retries increase, making the queue worse
- CPU looks "fine" because the bottleneck is waiting on something else
If you're new to interpreting these shapes, you'll move faster with: reading P50/P95/P99 properly .
Little's Law (practical version)
In-flight work ≈ throughput × latency. When latency rises and throughput doesn't, in-flight work grows — which often means the system is accumulating a queue.
Where queues hide in real systems
"Queue" doesn't always look like a message broker backlog. In production, queues hide inside:
- Thread/worker pools: request handlers waiting for a worker slot
- Connection pools: waiting to acquire DB/Redis/HTTP connections
- Locks & coordination: waiting on mutexes, DB locks, leader hotspots
- Async pipelines: queue depth, consumer lag, DLQ retries
- Infrastructure: load balancer queues, kernel run queue, disk I/O queue
- Downstream limits: throttling, quotas, brownouts (which create "soft queues" via retries/backoff)
Your job is not to "optimize everything." It's to find where the first queue forms on the critical path.
Fast triage: the 10-minute queueing check
Before you touch code, run this quick checklist. The output should be a strong hypothesis: "requests are waiting on X."
1) Confirm a queueing shape
- P50 stable, P95/P99 worsening
- Latency bends upward around a load threshold (the "knee")
- Throughput flattens (or errors rise) as latency grows
2) Find the first visible waiting point
- Pool waits: DB acquire wait time, HTTP client acquire wait time
- Backlog: queue depth and processing lag (async)
- Lock waits: contention metrics, DB lock waits
- Worker starvation: handler queue length or "time-to-start-processing" spikes
- Downstream throttling: rate-limit errors, increased dependency latency + retries
3) Pull tail traces for one critical flow
Look at the slowest 1% (or requests above a threshold) and identify the dominant "wait segment": pool acquire, queue wait, lock wait, retry/backoff, downstream throttle. Then correlate that wait segment with the matching metric.
How to prove latency is mostly waiting time
You want evidence that is hard to argue with: (1) a wait segment dominates tail traces, and (2) a saturation signal rises at the same time.
Proof method A — Trace decomposition
- Find spans that represent waiting: acquire connection, queue wait, lock wait, retry backoff
- Compare tail traces vs median traces: is the difference mostly waiting?
- Confirm the waiting segment grows first as P99 worsens
Proof method B — Correlation with one saturation metric
Pick a single metric that corresponds to the wait segment: pool acquire wait time, queue depth/lag, lock wait time, throttling rate. If it rises alongside P95/P99, you've got a credible bottleneck.
Proof method C — Reversible mitigation (reduce admission)
Queueing problems often respond immediately to reduced admission: cap concurrency, shed non-critical traffic, or temporarily reduce fan-out. If P99 improves dramatically without code changes, you likely confirmed queueing.
Queueing is usually one link in a larger constraint chain. The safest approach is baseline → segment → trace → confirm saturation → fix → verify. If you need a decision-ready diagnosis and an evidence pack, start with a production audit .
Common root causes of queueing
Queueing is a symptom. These are the causes we see most in production:
- Over-admission: too much concurrency for a shared resource (DB, cache, external API)
- Bursty traffic: spikes create instantaneous queues even if averages look fine
- Long-tail work: a small fraction of "expensive requests" blocks the rest (head-of-line effects)
- Mixed workloads: heavy endpoints share pools with latency-sensitive endpoints
- Fan-out amplification: parallel calls increase tail latency and saturate dependencies
- Retries and timeouts: partial slowdowns trigger retry storms and collapse throughput
- Downstream throttling: rate limits turn into wait time + retries
- Serialization hotspots: locks, single-leader sections, hot keys/partitions
If you haven't already, it's worth reading the upstream diagnosis workflow: constraint chain mapping .
Fix patterns (ranked by leverage)
Don't treat queueing with random "performance tweaks." Fix by leverage: reduce waiting, reduce variance, then scale.
Tier 1 — Control admission (stop runaway queues)
- Cap concurrency per dependency (DB, external API)
- Bound queues (prefer bounded queues + fast failure over infinite buffers)
- Backpressure early in the request path
- Load shedding for non-critical paths to protect critical flows
Tier 2 — Reduce service time and variance (make queues less likely)
- Remove unnecessary work on the critical path
- Batch/coalesce to reduce fan-out and round-trips
- Fix N+1/query explosion patterns
- Reduce lock contention / serialization
Tier 3 — Isolate workloads (prevent one class from poisoning the tail)
- Separate pools for heavy vs latency-sensitive endpoints (bulkheads)
- Route expensive requests to async pipelines where possible
- Partition hot tenants/keys to spread load
Tier 4 — Add capacity (only after proving the constraint)
Scaling can help if the bottleneck is parallelizable and you're not gated by serialization. If you scale without fixing queueing behavior, you often move the bottleneck and keep the tail bad.
Verification: did you move the knee?
Queueing fixes must be verified under comparable conditions. Otherwise you can "feel better" without actually increasing headroom.
Verification checklist
- Comparable load: same flow, same segment, similar traffic shape
- Better distributions: P50/P95/P99 improve (not only averages)
- Knee moved right: you can handle higher load before latency bends upward
- Waiting reduced: pool wait/lock wait/backlog decreases and stays stable
- Error mix improved: timeouts and retries drop
If you can't produce a before/after evidence pack, treat the change as unproven and add instrumentation first.
Guardrails: keep queueing from coming back
Queueing regressions are common because they often depend on traffic shape and concurrency. Guardrails help you detect "waiting creep" early.
- Dashboards: pool acquire wait, queue depth/lag, lock waits, in-flight/concurrency
- Alerts: sustained waiting metrics + rising P95/P99 (paired signals)
- Release checks: detect tail widening after deploy (P50 stable, P95/P99 worse)
- Runbooks: first 10 minutes: identify the waiting point and apply safe admission control
When to escalate to a full audit
You should consider a structured audit when:
- Queueing appears only at peak traffic and you can't reproduce safely
- Multiple queues interact across services (constraint chain)
- Retries/timeouts amplify the problem and create cascading failures
- You need a prioritized plan with verified fixes and guardrails
If you need audit-first diagnosis and execution support: request an audit or ship fixes with verification .
Next reads
FAQ
Questions readers usually ask next
What is queueing delay?
Queueing delay is time spent waiting before work starts (waiting for a worker, a pool slot, a lock, I/O, or a downstream dependency). When demand nears capacity, queueing delay can dominate P95/P99 latency.
Why does P99 explode under load while CPU is normal?
Because the bottleneck is often a queue elsewhere: thread/worker pools, DB connection pools, lock contention, message backlogs, I/O queues, or downstream throttling. These create waiting time without maxing CPU.
How do I prove latency is mostly waiting time?
Use tail traces to decompose latency and look for long waits (queue/pool/lock). Correlate that wait with a matching saturation signal (pool acquire wait, queue depth/lag, lock waits, or throttling). Then verify by reducing admission or load and observing immediate P99 improvement.
What should I alert on to catch queueing early?
Alert on sustained waiting signals: pool acquire wait time, queue depth/backlog and processing lag, lock wait time, and rising retries/timeouts—paired with rising tail latency. CPU alone is not sufficient.
Tail widens first
Queueing often shows up as tail-first degradation: P50 stable, P95/P99 worse, then timeouts.
Find the first queue
Queues hide in pools, workers, locks, backlogs, and downstream throttling. Locate the first one on the critical path.
Control admission
Bounded queues + backpressure prevent meltdown. Reduce waiting before you scale.
Verify the knee
Re-baseline under comparable load and prove headroom improved: better P95/P99 and stable error mix.
Stuck in "optimize random things"?
Queueing problems require evidence: identify the waiting point, confirm saturation, then fix and re-baseline. Start audit-first.
Last updated
February 4, 2026