Constraint Mapping
Most systems have a constraint chain. Remove the primary ceiling, re-baseline, and the next constraint will reveal itself.
When performance gets worse, teams often hunt for "the bottleneck." In real production systems, the truth is usually a constraint chain: one ceiling reveals the next, and fixes shift the bottleneck downstream.
Constraint mapping is how you turn latency charts into decisions. You start with a baseline, segment until the distribution becomes readable, prove whether the tail is waiting or work, trace the request path end-to-end, and build a ranked map of constraints you can fix in order.
What "constraint mapping" actually means
Constraint mapping is the process of identifying: (1) where requests spend time, (2) where they wait, and (3) which resource saturates first along a critical flow. The output is not a list of opinions. It is a chain of evidence: distributions, traces, saturation signals, and a prioritized plan.
A good constraint map includes:
- Flow scope: the one path that matters (checkout, login, search)
- Segments: region/tier/device/payload slice where the problem is visible
- Decomposition: top spans contributing to P95/P99
- Saturation: the ceiling signals (pools, locks, queue depth, CPU throttling)
- Ranking: "fix this first" based on impact and risk
The constraint chain (why bottlenecks move)
If you remove a DB bottleneck, the next ceiling might be cache miss amplification. If you fix cache stampedes, the next ceiling might be a worker pool or a downstream API. That's not failure — it's progress. The goal is to remove constraints in descending order of leverage until the system has headroom.
Before you start: pick a flow + define a comparable window
Constraint mapping fails when the scope is fuzzy. Pick a single critical flow and define a comparable baseline window: same route, same segment, same traffic shape, and known system state (release/config).
Lock these inputs:
- Flow: route + success criteria
- Segments: region, tier, platform
- Window: time bucket with stable traffic patterns
- State: release version, feature flags, config
Step 1: Baseline distributions and context
Start with distributions, not averages. Capture P50/P95/P99 for the critical flow, plus throughput and error mix. Add one saturation signal per tier (service, DB, cache, queue) so you can spot where waiting forms.
Baseline set (minimum):
- Latency: P50/P95/P99 by minute (or small buckets)
- Load: RPS + in-flight/concurrency
- Errors: timeouts, retries, 5xx
- Saturation: DB pool/locks, queue depth/lag, CPU throttling
Step 2: Segment until the shape becomes readable
Mixed workloads are the #1 reason teams misdiagnose constraints. Segment before you interpret. Start with endpoint/flow, then slice by region/tier/payload size until the change is obvious.
High-leverage slices:
- Endpoint: critical flow vs everything else
- Region: geo / POP differences
- Tenant/tier: "one customer is slow" patterns
- Status: success vs timeout/retry paths
- Data shape: cart size, result size, payload size
Step 3: Classify the distribution shape
Before you jump to root cause, classify what you're seeing:
- Tail widening: P50 stable, P95/P99 worse → queueing/contestion/pool exhaustion/downstream slowness
- Whole shift: P50/P95/P99 all worse → more work per request (code/data/dependency)
- Bimodal: two clusters → segmentation issue (tier/region/path), or a dependency path split
Step 4: Prove waiting vs work
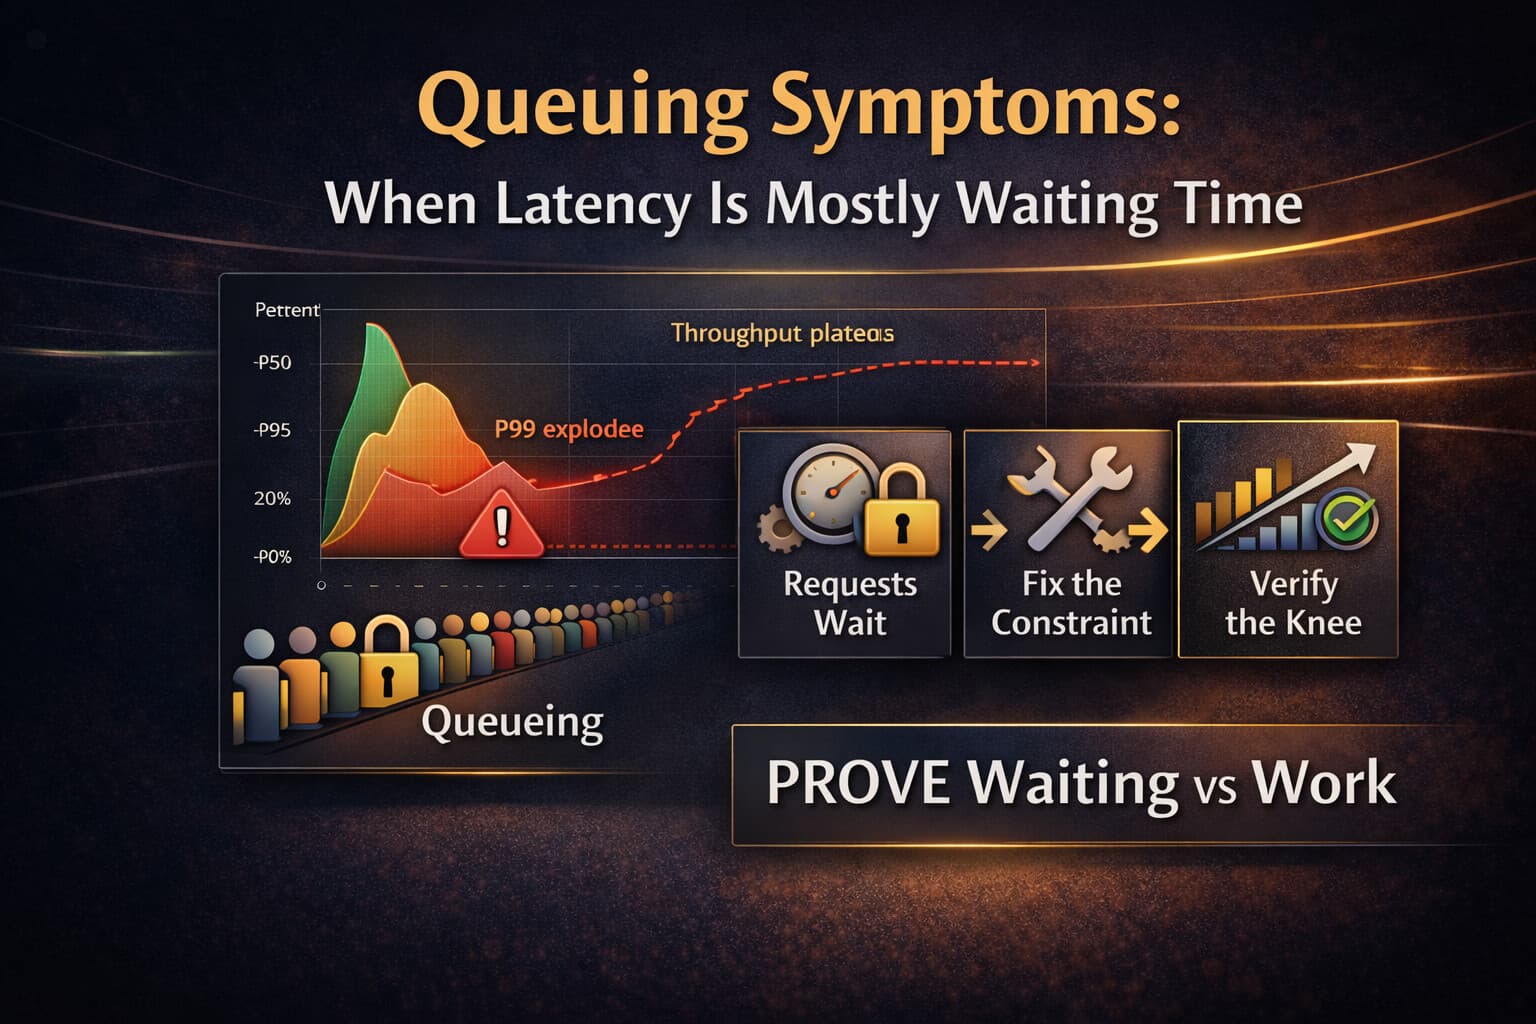
This is the pivot. You want to know whether requests are slow because they are doing more work or waiting longer. Waiting points to queueing: pool exhaustion, locks, overloaded downstream, or thread starvation.
Practical ways to prove waiting:
- Span breakdown: large time in "acquire connection," "lock wait," "queue wait," or "semaphore wait" spans
- Pool metrics: utilization near 100%, wait time rising
- Queue metrics: backlog depth and processing lag increasing
- Saturation knees: latency bends upward as load increases
Step 5: Trace decomposition (find where the time went)
For the problematic slice, pull traces from the tail (e.g., the slowest 1% or requests over a threshold). Identify which spans dominate latency and whether they are local work or downstream waiting.
Questions to answer from traces:
- Which span grows first when P99 worsens?
- Is the time in app code (CPU) or dependency time (DB/cache/external)?
- Are retries present? Are timeouts cutting off the tail or extending it?
- Does the slow path correlate with payload size, tenant, region, or cache misses?
Step 6: Confirm with saturation signals
Traces show you where time goes. Saturation tells you why time goes there. Confirm the suspected constraint with one or two strong signals: pool utilization + wait time, lock waits, queue backlog/lag, CPU throttling, or downstream error/latency.
Examples:
- DB pool exhaustion: pool utilization pegged + acquire wait spans + timeouts
- Lock contention: lock wait time rising + tail widening + retries
- Queueing at workers: backlog depth rising + processing lag + request timeouts upstream
- CPU throttling: throttled time rising + request latency shift at high load
Step 7: Build the constraint map (ranked by leverage)
Now you can write the map. The map is a ranked list of constraints with evidence and an action plan. Keep it short and specific.
Constraint map template:
- Constraint #1 (primary): what it is, how we know, impact on P99/throughput, fix options, verification plan
- Constraint #2 (next): expected to surface after #1 is removed
- Constraint #3 (guardrail): regression prevention (alerts, SLOs, rollout safety)
Your goal is to remove one constraint at a time and re-baseline. Don't "optimize everything." That creates risk without clarity.
Step 8: Fix the primary constraint and re-baseline
Ship the smallest change that removes the primary ceiling. Then re-run the baseline on the same slice and window. If the bottleneck moved, you're doing it right.
Fix sequencing rule:
- Prefer constraint removal over "add capacity"
- Prefer reducing waiting over micro-optimizing CPU
- Add guardrails so the improvement persists
Walkthrough: checkout under peak load (a realistic example)
Here's a real-world style walkthrough using the workflow above (details anonymized, pattern true). The symptom: during peak events, checkout P99 spikes from ~700ms to 4–8s, and timeouts appear.
1) Baseline + context
- Scope: checkout "place order" endpoint
- Segment: US region, logged-in users
- Window: same weekday peak window, comparable traffic
- Observed: P50 stable, P95 up moderately, P99 explodes → tail widening
2) Segment
Slicing reveals the issue is concentrated in orders with larger carts and higher payment retries. That's the first hint: data shape + retries might be amplifying the tail.
3) Trace decomposition
Tail traces show two dominant spans: (a) "acquire DB connection" wait time, and (b) a slow write in the payment ledger table. Many traces show retries after timeouts, multiplying load during the peak.
4) Confirm saturation
- DB pool utilization pegged near 100% during peak
- Acquire wait time rises sharply
- Lock wait time increases on a hot index/row range
5) Map constraints
- #1 Primary: DB connection pool exhaustion driven by lock contention on ledger writes
- #2 Next: retry amplification during partial slowness
- #3 Guardrail: release validation to catch tail widening + pool wait regressions
6) Fix + verify
A targeted fix reduces lock contention (e.g., change write pattern / batching / key design) and adds backpressure + safer retry policy. After re-baseline on the same window: P99 drops from seconds to under 1s, timeouts disappear, and the knee shifts right (more headroom at peak RPS).
Verification: proving the constraint moved
Verification is where constraint mapping becomes real engineering: prove that (a) tail latency improved, (b) saturation shifted, and (c) the system now tolerates more load.
Verification checklist:
- Same slice + comparable traffic window
- Before/after distributions (P50/P95/P99) + throughput + error mix
- Saturation signals confirm the knee moved right
- Trace breakdown shows reduced waiting or reduced dependency time
- Guardrails added: alerts, runbook triggers, release checks
Common failure modes in constraint mapping
- Skipping segmentation: mixed workloads hide the real constraint
- Chasing averages: optimizing "mean latency" while the tail burns
- Fixing without re-baselining: no proof, no learning
- Assuming one bottleneck: the chain shifts; expect it
- Ignoring retry behavior: recovery traffic becomes the load
When to escalate to a full audit
If you can't isolate the primary constraint within a few cycles — or issues appear only under peak traffic — you likely need deeper instrumentation, workload validation, and a prioritized plan.
Next reads
Practical snippet
Find tail traces (example filters)
Use this as a starting point; adapt attributes to your tracing vendor/schema.
service.name="checkout"
http.route="/checkout/place-order"
(status_code>=500 OR error=true OR duration_ms>1500)
AND region="us"
AND (cart_size>=20 OR retry_count>=1)
Tip: sample from the slowest 1% (or a duration threshold) on the *same segment + window* you used for the baseline.
Verification checklist
Use this after shipping the primary constraint fix (same slice + comparable traffic window).
FAQ
Questions readers usually ask next
What is constraint mapping?
Constraint mapping is the process of identifying where requests spend time, where they wait, and which resource saturates first along a critical flow. The output is a chain of evidence: distributions, traces, saturation signals, and a prioritized plan—not opinions.
Why do bottlenecks move after I fix one?
This is normal and expected. When you remove one constraint (e.g., DB pool exhaustion), the next ceiling reveals itself (e.g., cache miss amplification, worker pool, downstream API). That's progress—the goal is to remove constraints in descending order of leverage until the system has headroom.
How do I prove latency is mostly waiting vs work?
Use tail traces to decompose latency and look for long waits (pool acquire, lock wait, queue wait). Compare tail traces vs median traces—if the difference is mostly waiting, you have queueing. Confirm with saturation signals: pool utilization + wait time, lock waits, queue backlog/lag, or CPU throttling.
What's the fastest way to find the primary constraint?
Pick one critical flow, baseline distributions (P50/P95/P99), segment until the shape is readable, pull tail traces to find where time goes, and confirm with one saturation signal (pool wait, lock wait, backlog, throttling). Then fix the primary constraint and re-baseline to verify the knee moved right.
Baseline + Segment
Start with distributions and slice until the change is readable. Mixed workloads hide constraints.
Waiting vs Work
Prove whether the tail is queueing (waiting) or real work. This determines what you fix first.
Trace Decomposition
Identify spans dominating P99 and correlate with saturation signals to confirm the constraint.
Verify the shift
After a fix, prove the knee moved right: better P95/P99 under comparable load with stable error mix.
Stuck in "guess and optimize"?
If performance work feels like guesses, you need evidence: baselines, traces, saturation, and verification. See how the audit works.
Last updated
February 2, 2026