Saturation ≠ Utilization
Most tail latency issues are waiting problems. Look for queues: pool acquire waits, lock waits, backlog, throttling — not just CPU%.
When P99 gets worse, teams often look at CPU first. In real systems, the tail is frequently dominated by waiting: waiting for a DB connection, a worker slot, a lock, disk I/O, network, or a downstream quota. That's why you can have timeouts under load while CPU looks "fine."
This playbook helps you spot saturation signals beyond CPU, prove the real capacity ceiling with evidence, and verify that your fixes actually moved the knee right. If you want the full end-to-end workflow, read: Finding the constraint chain .
Rule of thumb
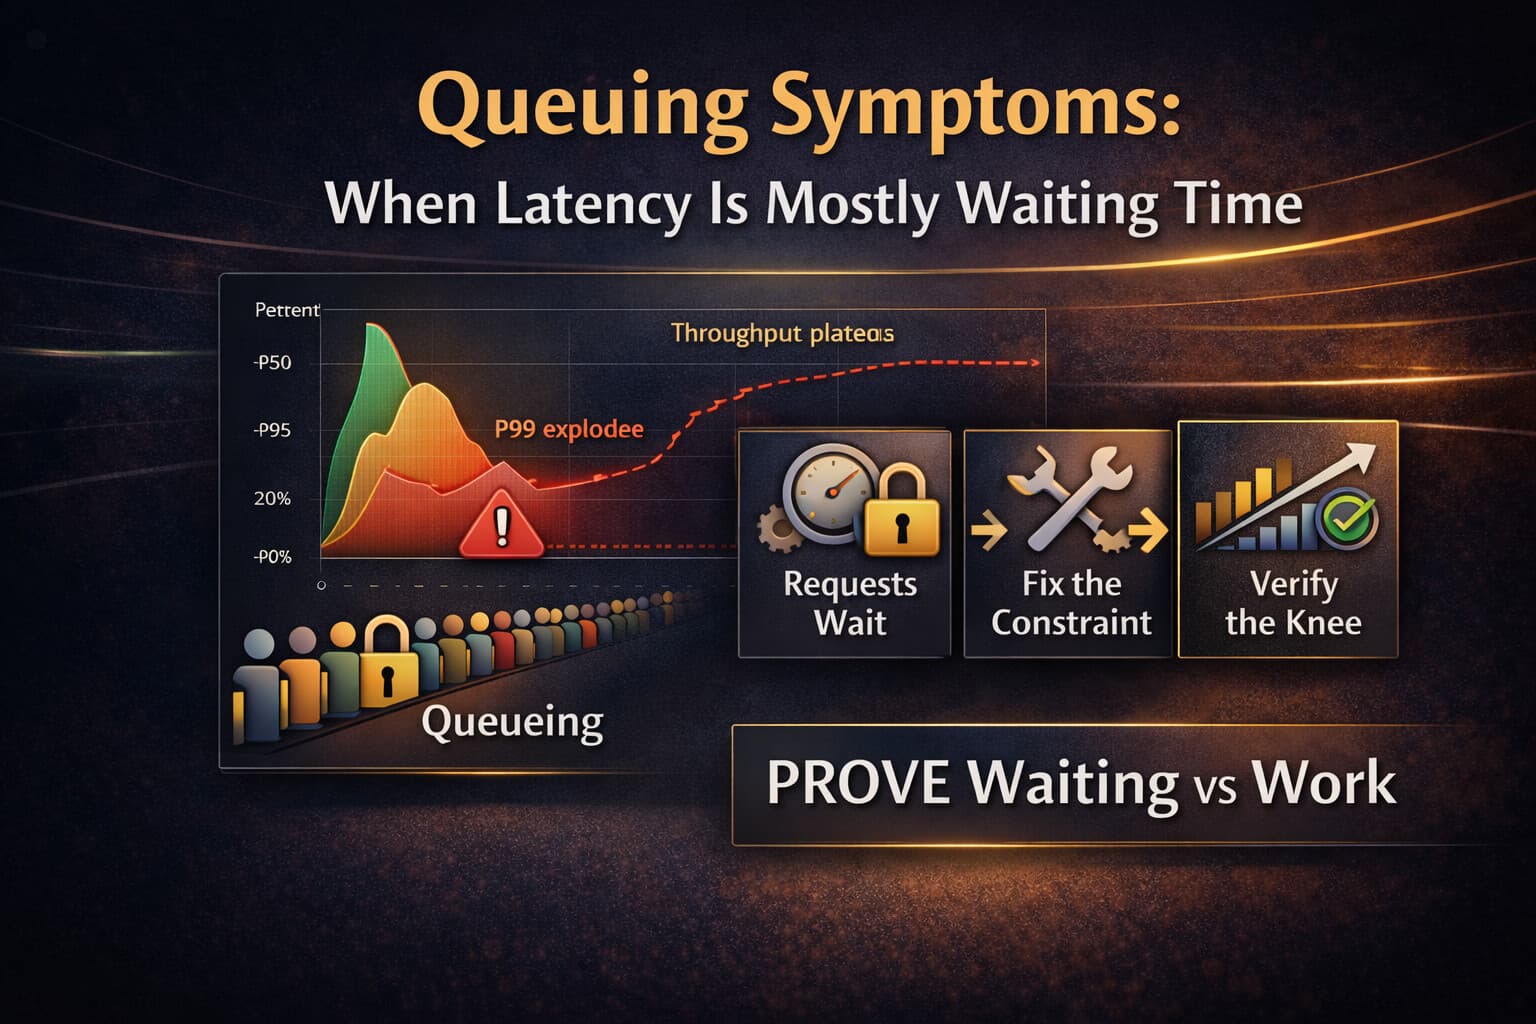
If throughput plateaus and P95/P99 climb faster than load, you're usually seeing saturation + queueing — not "slow code."
Saturation vs utilization (why CPU misleads)
Utilization is how busy something looks. Saturation is when demand exceeds capacity and creates queues (wait time). Tail latency grows nonlinearly because queues compound in the critical path.
CPU can look normal while you're saturated because:
- Work is serialized: locks, leader hotspots, single-threaded sections, sync I/O in an async path
- Capacity is capped elsewhere: DB connections, worker pool slots, upstream quotas
- Waiting dominates the tail: P50 stays stable while P95/P99 widen (classic "tail first" pattern)
- Retries amplify load: partial slowdowns turn into retry storms and collapse throughput
If you don't already have a trusted measurement baseline and distribution literacy, start here: Production performance baseline and reading P50/P95/P99 .
Fast triage: the 10-minute saturation scan
When P99 spikes or throughput plateaus, run this scan before changing code. The goal is to answer one question: Where can requests wait?
Step A — confirm it's "waiting" (not just more work)
- P99 rises sharply while CPU stays flat
- Timeouts increase while averages look okay
- Throughput stops scaling as you add replicas
- Tail traces show long gaps before a span starts (queued) or long "acquire" spans (pool waits)
Step B — list your waiting points
- Pools: DB connections, HTTP client connections, thread pools, worker slots
- Queues: in-service queues, message backlogs, load balancer queues
- Locks: application locks, DB locks, coordination hotspots
- Infrastructure: disk I/O queues, network retransmits/drops
- Downstream limits: rate limiting, quotas, throttling, brownouts
Step C — pick one critical flow and pull tail traces
Pull traces from the slowest 1% (or requests above a latency threshold) and find the dominant wait segment: pool acquire, lock wait, queue wait, retry, downstream throttling. Then confirm it with the matching saturation metric.
Saturation signals map (beyond CPU)
Use this table as your "bottleneck menu." For each ceiling, you want: (1) a symptom pattern, (2) a saturation signal, and (3) a proof method.
| Ceiling | What to measure | Saturation signal | User symptoms | How to prove |
|---|---|---|---|---|
| CPU / compute | CPU%, run queue, throttling/steal | Run queue grows; throttled time rises | P95/P99 bend upward at high load | Load step test shows knee; traces show CPU-heavy spans |
| Thread/worker pools | Queue length, wait time, active workers | Wait time grows while CPU stays flat | Timeouts + queued requests | Traces show long "time-to-start"; pool metrics correlate with tail |
| DB connection pool | Utilization, acquire wait, timeouts | Acquire waits spike; churn increases | P99 spikes under load; 5xx/timeouts | Trace shows "acquire connection" spans; correlate with pool wait |
| Locks / contention | Lock waits, contention rate, context switching | Lock wait dominates tail; throughput plateaus | Tail widens first; bursty spikes | Profiles/traces show blocking; DB shows lock waits/hot rows |
| Disk / storage I/O | IO latency, queue depth, fsync/checkpoints | IO queue builds; tail IO latency spikes | Latency spikes (often writes) | Correlate p99 with IO latency; inspect DB checkpoint/flush events |
| Network | RTT, retransmits, drops, bandwidth/pps | Retransmits/drops increase; tail RTT grows | "Random" spikes across services | Decompose timing boundaries; compare network vs app time |
| Memory / GC / runtime | Allocation rate, pause time, heap pressure | Pause spikes; frequent GC cycles | Periodic jitter; p99 spikes | Correlate pause events with tail; inspect allocation hot spots |
| Downstream throttling/quotas | Rate-limit errors, throttle latency, retries | Throttling rises; retries amplify demand | Partial outages; cascading failures | Trace shows throttled spans + retry patterns; error mix changes |
Notice the common theme: saturation usually manifests as queueing. Your job is to find where the queue forms first on the critical path.
How to prove the real bottleneck
A diagnosis is only useful if it is falsifiable. You want: (1) a bottleneck candidate, (2) a proof method, (3) a verification plan.
Proof technique 1 — Find the knee (capacity cliff)
Use a safe load step (or observe natural traffic spikes) and chart: throughput (RPS), P95/P99 latency, error mix, and the candidate saturation metric (pool wait, lock wait, backlog, throttling). If all bend together around a load point, you found a real ceiling.
Proof technique 2 — Decompose "work time" vs "wait time"
In traces, separate time spent doing work vs time spent waiting. If wait time dominates the tail, micro-optimizations won't matter until you address the wait source.
Proof technique 3 — Reduce demand temporarily (reversible mitigation)
- Reduce concurrency (admission control)
- Limit fan-out for a hot endpoint
- Disable a heavyweight feature flag temporarily
- Shed non-critical traffic
If P99 improves dramatically without code changes, you're very likely saturating a shared resource.
Pro tip
If you're not sure where to start, run the constraint chain workflow end-to-end: baseline → segment → trace decomposition → confirm saturation .
Fix options (ranked by leverage)
Once you've identified the ceiling, resist the reflex to "scale everything." Start with the highest-leverage fixes that reduce waiting on the critical path.
Tier 1 — Reduce work on the critical path (highest leverage)
- Remove unnecessary dependency calls
- Batch/coalesce requests; collapse fan-out
- Fix N+1/query explosion patterns
- Cache strategically (and plan for stampedes)
Tier 2 — Reduce coordination and serialization
- Eliminate lock hotspots / leader hotspots
- Partition hot keys and hot partitions
- Separate heavy endpoints into dedicated pools (bulkheads)
Tier 3 — Control concurrency (prevent queueing meltdowns)
- Admission control / backpressure before queues explode
- Right-size pools with explicit limits (avoid infinite queues)
- Rate limit at the edges to protect dependencies
Tier 4 — Add capacity (after the bottleneck is proven)
Scaling works when the workload parallelizes and when you're not limited by a serialized resource. If you scale without addressing queueing, you often just move the bottleneck and keep P99 bad.
Verification: did you move the ceiling?
After a fix, verification is the difference between engineering and guessing. Prove improvement under a comparable window and slice.
Verification checklist (minimum)
- Comparable load: same flow, same segment, similar traffic shape
- Distributions: P50/P95/P99 improved (not only averages)
- Headroom: knee moved right (more RPS before latency bends)
- Saturation: the key wait metric improved (pool wait, lock wait, backlog)
- Error mix: fewer timeouts/retries/throttles
- No hidden regressions: you didn't just relocate the pain to another tier
Guardrails to prevent regressions
Most teams fix a ceiling once — then it returns. Guardrails make improvements stick.
- Dashboards: pool wait + queue depth + lock waits + IO latency (per tier)
- Alerts: sustained wait time/backlog (not only CPU%)
- Release checks: compare P95/P99 and error mix pre/post deploy
- Runbooks: first 10 minutes: confirm waiting point + mitigation
When to escalate to a full audit
You should consider a structured audit when:
- The problem appears only under peak traffic (hard to reproduce safely)
- Multiple ceilings appear and the bottleneck keeps moving without real improvement
- You need an evidence pack + prioritized plan (fast)
- You suspect cross-service constraint chains (not a single component issue)
Audit-first path
If performance work feels like "guess and optimize," you need evidence: baselines, tail traces, saturation signals, and verification. Start with an audit or ship fixes with verification.
Next reads
FAQ
Questions readers usually ask next
Why is p99 latency high when CPU is low?
Because the bottleneck is often waiting rather than compute—pool exhaustion, queueing, lock contention, I/O latency, network retransmits, or downstream throttling. These create queues and amplify tail latency without maxing CPU.
What's the difference between saturation and utilization?
Utilization describes how busy a resource looks. Saturation describes when demand exceeds capacity, creating queues and wait time. Saturation is what drives nonlinear tail latency increases and timeouts under load.
Is high CPU always a problem?
Not always. High CPU can be acceptable if latency stays within SLO and queueing is controlled. It becomes a problem when latency bends upward and run queues grow, indicating the system is at a compute ceiling.
What is the fastest way to find the bottleneck?
Pick one critical flow, pull tail traces, find the dominant wait segment (pool/lock/queue/downstream), then confirm it with a matching saturation signal. Finally, validate by re-baselining under comparable load.
Queueing first
If P50 is stable but P95/P99 widen, suspect queueing: pools, locks, or downstream saturation.
Confirm with one signal
Pair tail traces with a matching saturation metric (wait time, backlog, throttling). Avoid guessing.
Fix by leverage
Reduce work on the critical path, reduce serialization, control concurrency — then scale if needed.
Verify the knee
Re-baseline under comparable load. Prove P95/P99 improved and the capacity knee moved right.
Stuck in "scale more servers"?
If CPU isn't the ceiling, scaling won't fix the tail. Audit the waiting points first. Start audit-first.
Last updated
February 4, 2026