The core idea
LLM features fail ROI reviews when teams measure transport events instead of business outcomes. The fix is unit economics by workflow, not prettier dashboards.
Many LLM features do not fail because the model is weak. They fail because the team enters the ROI review with mismatched units.
Engineering shows request volume and token spend. Product shows usage and a few happy anecdotes. Finance shows the invoice. Nobody can explain, in one defensible unit, what the feature costs and what it returns.
That is the moment where a strategically important feature gets labeled "interesting but uneconomic." The fix is not a better narrative. It is a review model that finance, product, and engineering can all interrogate without changing the denominator halfway through.
Context
Part of the Cost Optimization hub. Related: Cost per Successful AI Task, Reduce OpenAI Bill Without Hurting Quality, Model Routing for Cost Control, and the LLM ROI Rescue case study.
Why ROI reviews go sideways
Most ROI reviews collapse for a simple reason: cost is measured in hard dollars and value is presented in soft language.
- cost is shown per request while value is described at the initiative level
- usage is counted, but successful outcomes are not
- human rescue, fallback loops, and retry waste sit outside the visible AI budget
This creates an argument no executive can trust. If one side of the slide is an exact invoice and the other side is "users seem to like it," the invoice wins every time.
What leadership is really asking
For one economically meaningful unit of work, what does it cost us, what value does it create, and does the margin get better or worse as this thing scales?
The four numbers every CTO needs
A request is a transport event. It is not an economic unit. For ROI review purposes, the minimum useful model is four numbers per workflow:
- Eligible volume: how many tasks were actually candidates for the AI path
- Success rate: what share of those tasks ended in a business-acceptable outcome
- Full delivery cost: all attributable cost, including rescue and waste
- Value per success: avoided cost, protected revenue, or capacity unlocked per successful outcome
From those four numbers you can derive the metrics that matter:
Review formulas
successes = eligible volume x success rate
cost per successful outcome = full delivery cost / successes
gross margin = (successes x value per success) - full delivery cost
break-even success rate = full delivery cost / (eligible volume x value per success)
This is the first point where many teams realize they have been mixing exposure, usage, and success as if they were interchangeable. They are not. Once the units are locked, the review gets calmer and much less political.
Step 1: Define the successful outcome
The denominator has to survive scrutiny from finance, product, support operations, and the team running the queue. "The model answered" is not enough.
Good success definitions usually include:
- task completion or deflection
- minimum quality or groundedness threshold
- no major human rescue inside a defined time window
- an adoption context that makes the outcome meaningful
For example, a support copilot success might be "case resolved with grounded answer and no agent takeover within the session." Better still is a lookback window: no agent takeover and no ticket opened within 24 to 72 hours, depending on queue behavior. That is much harder to game than counting every chat response as a win.
Top-tier teams are strict here because they know silent re-asks, delayed escalations, and manual rewrites are where fake ROI comes from.
Step 2: Map the full delivery cost
Most teams understate cost because the visible model invoice is only one layer of the path.
Include at minimum:
- LLM input and output token spend
- embeddings, retrieval, reranking, and cache miss cost
- tool execution and third-party API calls
- retry waste, timeout waste, and fallback volume
- human review, correction, or escalation effort when it is operationally required
If your team says "human review is outside the AI budget," that is usually a sign the feature is being evaluated as a demo, not as a production capability.
A practical rescue-cost shortcut
rescue cost = rescued cases x average rescue minutes x loaded hourly rate / 60
It is not perfect. It is still far better than pretending rescue labor is free.
Once rescue cost is included, many "cheap" features stop looking cheap. That is not a measurement problem. That is the business reality finally becoming visible.
Step 3: Quantify value with hard proxies
CTOs often lose the room here by making value sound aspirational. Use concrete proxies that cash out into labor, throughput, or revenue:
- Avoided cost: fewer support tickets, fewer analyst minutes, fewer manual reviews
- Revenue protection: lower churn risk, faster response on revenue-critical flows, better conversion on high-intent users
- Capacity unlock: same team handles more throughput without proportional headcount growth
The rule is simple: if you cannot explain the labor or cash implication of a successful outcome, the review will drift back to cost containment.
Do not start with NPS, sentiment, or "strategic value." Those may matter, but they are second-order arguments. First get to a value proxy the CFO would not laugh at.
Worked example: support copilot under pressure
Consider a support copilot with the following monthly numbers:
- 150,000 assistant sessions
- 85,000 sessions that are actually eligible for deflection
- $42,000 model, retrieval, and tool cost
- $11,000 attributable human rescue cost
- 31,000 sessions that meet the no-escalation success definition
- $2.30 estimated avoided cost per resolved support case
The cost side is not $42,000. It is $53,000 once rescue is included.
Cost per successful outcome = $53,000 / 31,000 = $1.71
Gross value created = 31,000 x $2.30 = $71,300
Monthly gross margin = $71,300 - $53,000 = $18,300
Break-even success rate = $53,000 / (85,000 x $2.30) = 27.1%
Actual success rate on eligible intents is 31,000 / 85,000 = 36.5%. That gives the team roughly 9.4 percentage points of cushion above break-even.
That is the kind of detail leadership trusts. It does not just say the feature is positive. It shows how positive, how fragile that margin is, and where the safety buffer actually sits.
Now compare that with the lazy version of the review. If the team had divided spend by all 150,000 sessions, they would have reported an attractive-looking per-session cost while telling leadership almost nothing about whether the feature is economically sound.
How teams accidentally fake LLM ROI
- Using all sessions as the denominator: exposure is treated as economic throughput.
- Claiming same-session deflection: delayed tickets and follow-up escalations never get counted back.
- Excluding rescue labor: the AI looks cheap because human cleanup is hidden in another cost center.
- Blending all cohorts together: one negative-margin workflow disappears inside the average.
- Crediting AI with all downstream value: the review ignores that some outcomes would have happened anyway.
None of these are edge cases. They are the standard pattern behind features that look promising in demos and fragile in quarterly reviews.
The fastest way to lose credibility in an ROI review is to let finance discover one of these errors before engineering does.
A decision table leadership can act on
A useful ROI review is not a deck of screenshots. It is a small operating table with comparable cohorts and explicit decisions.
| Workflow | Success rate | Cost / success | Value / success | Margin / success | Decision |
|---|---|---|---|---|---|
| Order status and account FAQ | 58% | $0.72 | $2.10 | +$1.38 | scale on cheaper route |
| Returns and policy questions | 34% | $1.65 | $2.30 | +$0.65 | keep, improve retrieval |
| Complex billing disputes | 11% | $6.40 | $3.10 | -$3.30 | route to human earlier |
This changes the leadership conversation from "is AI working?" to "which workflows deserve more autonomous coverage, and which ones are burning margin?"
The interventions that usually move the number
Once the economics are visible, the fix order is usually obvious.
- remove negative-margin cohorts from the autonomous path before optimizing anything else
- tighten the success definition so the denominator matches real value
- use model routing so trivial tasks do not pay large-model prices
- reduce hidden waste through timeout control, caching, fewer fallback loops, and better stop conditions
- improve retrieval or tool reliability where rescue cost is dominating the numerator
- prove quality holds with before/after benchmarking instead of trusting intuition
This is why pure prompt tuning rarely rescues an ROI review on its own. The real savings often sit in routing policy, retrieval quality, escalation policy, and task selection.
Operating cadence for CTOs
You do not need a huge finance workstream. You need a monthly operating cadence with the same small set of numbers:
- eligible volume, success rate, and cost per success by top workflow
- value per success and break-even threshold by workflow
- fallback, escalation, delayed-ticket, and human rescue rate
- top three positive-margin cohorts to scale
- top three negative-margin cohorts to redesign, constrain, or stop
That cadence makes ROI reviews much less political. The feature either earns more investment, gets narrowed to a healthier scope, or gets paused before more spend accumulates.
The key question for the CTO is not "is the LLM feature valuable?" It is "which workflows clear the hurdle rate, which ones miss it, and what is the cheapest structural change that moves the miss group back above break-even?"
Need a defensible LLM ROI baseline?
We help teams measure cost per successful outcome, find the cohorts destroying margin, and prove whether routing, retrieval, or workflow changes actually improve the business case.
FAQ
Questions readers usually ask next
Why do LLM features often fail ROI reviews?
Because teams usually present cost per token, total spend, or request volume instead of outcome economics. Leadership wants to know what one successful outcome costs, what value it creates, and whether the margin improves or degrades at scale.
What four numbers should a CTO bring to an LLM ROI review?
At minimum: eligible workflow volume, success rate, full delivery cost, and value per successful outcome. From those four numbers you can derive cost per successful outcome, gross margin, and the break-even success rate leadership actually needs to make a scale or stop decision.
How should rescue labor be counted in LLM feature cost?
If humans routinely validate, rewrite, or recover failed outputs, that labor is part of delivery cost. A practical method is to multiply rescued cases by average rescue minutes and a loaded labor rate, then include that in the workflow numerator along with model, retrieval, tool, and infrastructure cost.
When should a CTO pause an LLM feature?
Pause or redesign when the feature has persistently negative unit economics, weak adoption, poor success quality, or value that depends on optimistic assumptions nobody can verify. If the margin is negative and the team cannot explain why, more scale usually makes the problem worse.
Most common denominator mistake
Counting requests, sessions, or generated answers as success. If the user still escalates or rewrites the output, the denominator is overstated.
Most common cost blind spot
Human rescue. Teams often remove it from the AI budget, then wonder why finance does not believe the ROI story.
Need a review-ready unit economics model?
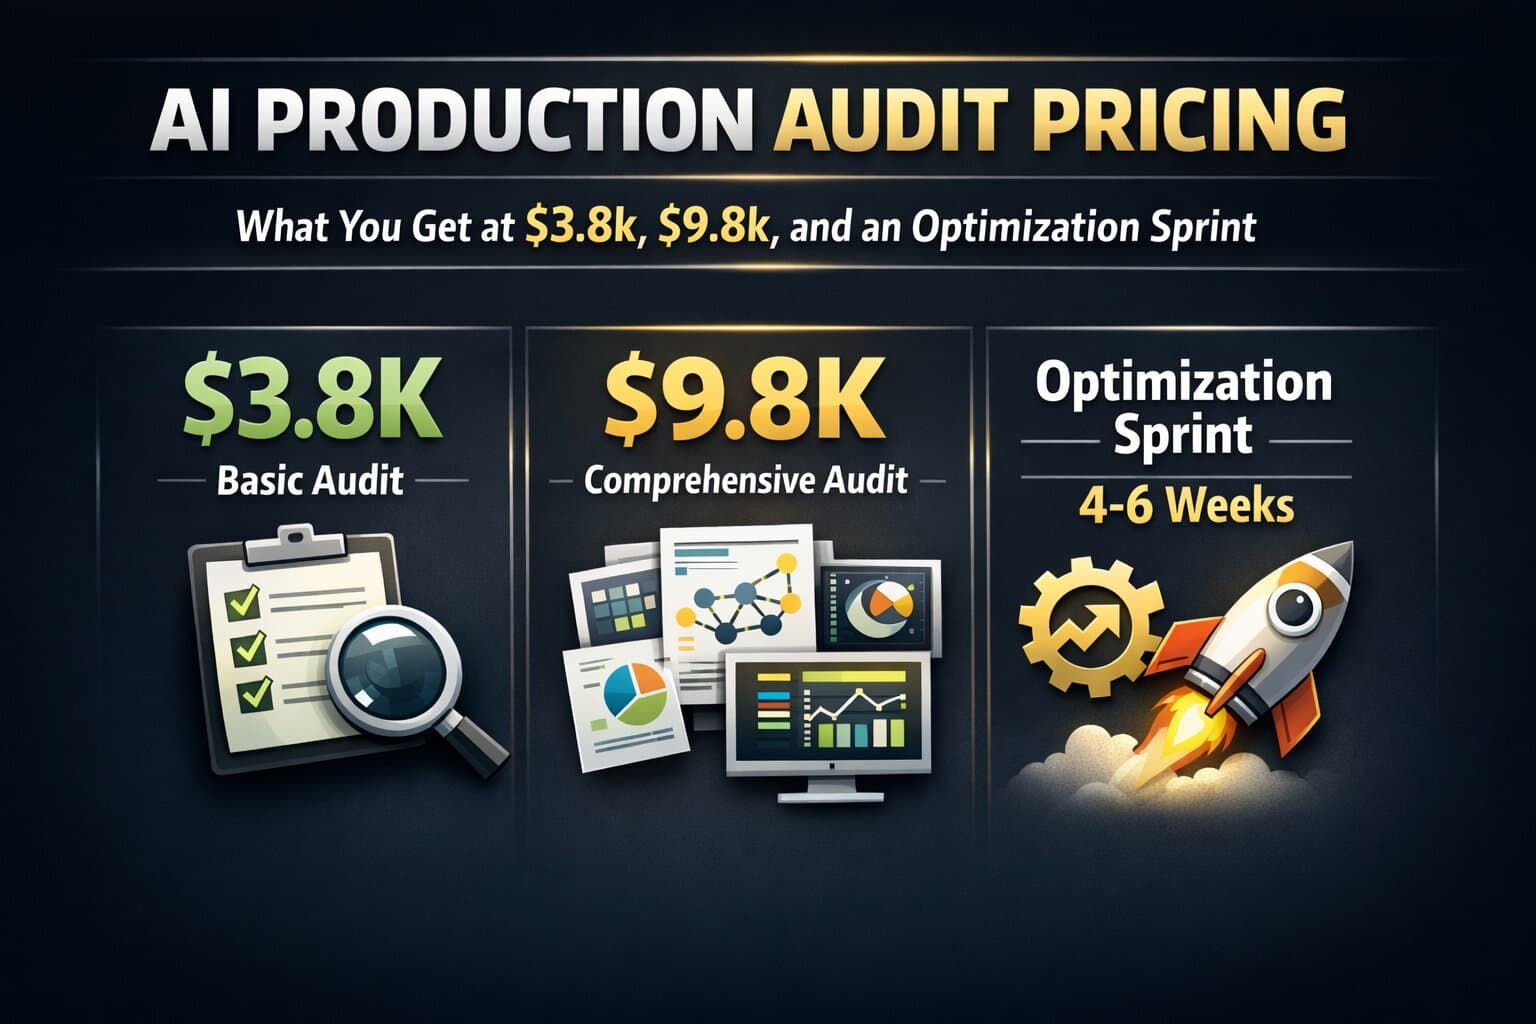
We help teams baseline AI cost, define decision-grade success metrics, and show whether a feature should scale, narrow, or stop. Start with an AI Production Audit.
Last updated
March 17, 2026