The core idea
Production evaluation is not one quality score. It is a layered measurement system that protects outcomes, trust, policy, cost, and operational stability at the same time.
If you change a prompt or swap a model in production, you are not making a copy tweak. You are changing the behavior of a probabilistic system that affects quality, trust, cost, and operational risk all at once.
That is why "the answer looked better in a few examples" is not a release process. Before you ship a model or prompt change, you need a measurement framework that reflects how the system actually creates value and how it actually fails.
This article gives you that framework: what to measure, why each metric matters, how the metrics fit together, and how to turn them into release rules instead of post-launch surprises.
Context
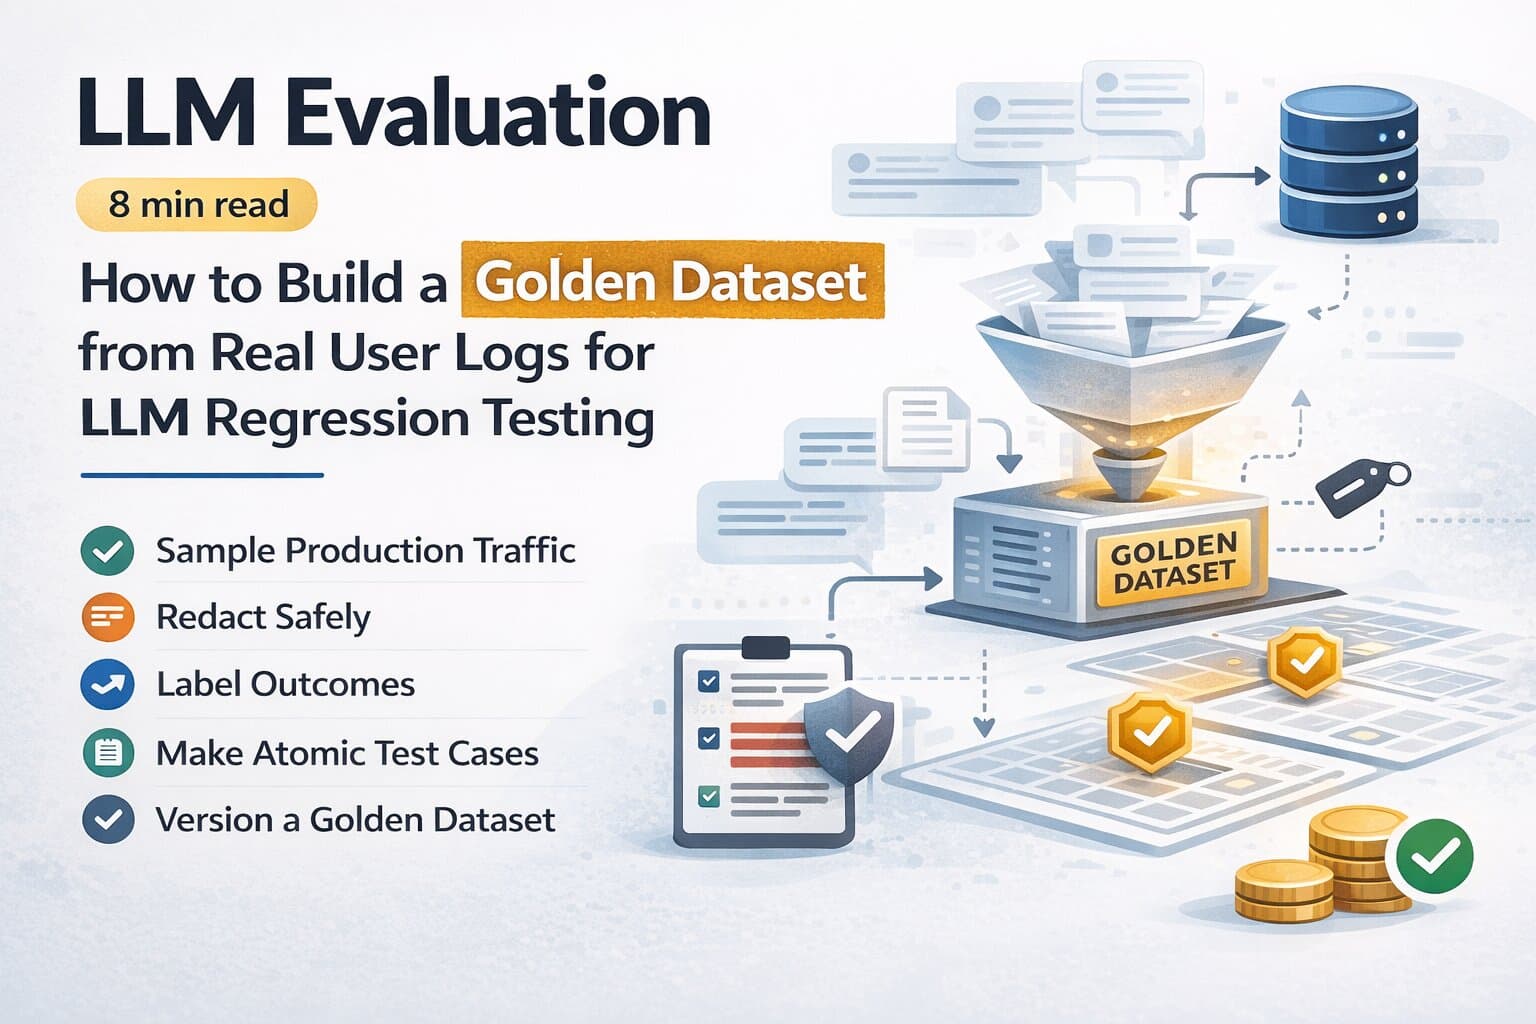
Part of the LLM Evaluation hub. Related: Golden Dataset from Real User Logs, Minimum Viable Eval Starter Kit, Do You Need an LLM Audit?, LLM Eval Suite case study, Reliability Retainer.
Why one metric is never enough
Teams often ask for "the right eval metric" before a release. That question is already too narrow.
In production, a change can improve one thing while quietly breaking another:
- a cheaper model lowers cost but increases escalation rate
- a prompt tweak improves tone but reduces groundedness
- a formatting instruction improves schema compliance but slows the workflow and increases retries
- a retrieval change helps the average query while breaking one high-value cohort
If you only track one aggregate quality score, those tradeoffs disappear. The job of an evaluation framework is to make them visible before users discover them first.
The production evaluation stack at a glance
| Layer | Question | Example metrics |
|---|---|---|
| Outcome | Did the user goal get solved? | task success, resolution rate, escalation rate |
| Groundedness | Was the answer supported by evidence? | citation validity, grounded answer rate |
| Instruction / format | Did it follow the contract? | JSON validity, required fields, style compliance |
| Safety / policy | Did it stay inside boundaries? | violation rate, refusal correctness, sensitive leakage |
| Tools / workflow | Did the system take the right steps? | tool success, loop rate, workflow completion |
| Operations | Is it viable to run? | cost per successful task, P95 latency, timeout rate |
| Cohorts | Who got worse? | metrics by intent, tenant, language, document type |
That stack is the real answer to "what should we measure?" You measure enough to see both user impact and operational side effects.
1) Outcome metrics: did the system actually solve the task?
Outcome metrics sit at the top because they tie everything back to value. If the user goal is not solved, a great schema score or a faster answer means very little.
Typical outcome metrics:
- task success rate
- case resolution rate
- handoff or escalation rate
- user re-ask rate within the next turn or session
Use the product reality, not a lab fantasy. If the system is meant to deflect support tickets, measure resolution and escalation. If it extracts structured data, measure extraction success, not just "response quality."
2) Groundedness metrics: was the answer supported?
This matters most for RAG, enterprise assistants, policy-heavy workflows, and any domain where confident wrong answers destroy trust.
Measure things like:
- grounded answer rate
- citation validity
- unsupported claim rate
- answer uses wrong document or wrong passage
Many teams say "quality improved" when what really improved was fluency. Fluency is not groundedness. If a prompt or model change makes the answer sound better while weakening evidence quality, that is a regression.
3) Instruction and format metrics: did it follow the contract?
A production assistant usually has output constraints: valid JSON, required fields, short format, specific tone, mandatory refusal language, or structured tool arguments.
Track:
- JSON parse success
- schema compliance
- required field presence
- instruction-following success for critical prompts
- verbosity or length violations
This layer catches a common production failure: the answer is "good" in spirit, but unusable by the downstream system.
4) Safety and policy metrics: did risk boundaries hold?
Safety is not a subset of style. It needs its own tracked metrics and its own release rules.
Examples:
- policy violation rate
- refusal correctness
- PII leakage or privacy violations
- unsafe tool suggestions or actions
- prompt-injection susceptibility for retrieval systems
A release should not pass because average quality improved if a critical safety or compliance boundary broke.
5) Tool and workflow metrics: did the agent do the right work?
For agentic systems, evaluating only the final answer hides the operational failure modes that drive cost and trust issues.
Measure:
- tool success rate
- workflow completion rate
- loop rate or repeated-call rate
- wrong tool selection rate
- tool output validation success
A candidate model may look smarter in the answer but still trigger worse tool behavior, more loops, or more retries. If you do not measure that layer, you will approve regressions that hurt operations.
6) Cost and latency metrics: was the change operationally acceptable?
Engineering teams often separate quality from operations. Production users do not. A model or prompt change that improves output quality by a tiny amount but doubles cost or adds painful latency may still be the wrong release.
Minimum operational metrics:
- cost per successful task
- input and output token usage
- P95 latency and time to first token
- timeout rate
- retry rate
These metrics are especially important when comparing models, adding more context, or changing tool orchestration.
7) Cohort and drift metrics: who got worse?
Aggregate improvement can hide local failure. This is one of the most common production mistakes in LLM evaluation.
Always segment by at least a few meaningful cohorts:
- intent or workflow type
- tenant or customer tier
- language or locale
- document type or source
- high-risk vs low-risk queries
If a model change helps the common low-risk path and hurts the highest-value cohort, the release may still be a net loss.
Cohort rule
Never approve a model or prompt change on aggregate score alone. Review the high-risk cohorts separately before ship or block.
The minimum scorecard before any model or prompt change
If you need a practical baseline, start with this scorecard:
| Metric | Why it belongs | Typical release use |
|---|---|---|
| Task success | Primary user outcome | Approve only if stable or improved |
| Groundedness / citation validity | Protects trust for factual workflows | Block on meaningful regression |
| Schema or instruction compliance | Protects downstream systems | Block on hard failures |
| Safety / policy | Protects risk boundaries | Block on critical violations |
| Tool or workflow success | Protects agent behavior | Warn or block depending on severity |
| Cost per successful task | Shows economic tradeoff | Approve only if cost increase is justified |
| P95 latency | Protects UX and throughput | Warn or block if beyond budget |
This is the smallest scorecard that usually reflects reality. Expand later with domain-specific metrics, not before.
Release rules: when to block, warn, or ship
Metrics without rules turn into dashboard theater. Decide in advance how you will treat regressions.
A simple release policy:
- Block: critical safety or policy failure, broken hard constraints, or significant degradation in top-tier cohorts
- Warn: small regression in non-critical cohorts or operational metrics that still stay inside budget
- Ship: candidate improves key metrics or holds them steady inside agreed thresholds
The important part is consistency. If you improvise release rules after seeing the results, the framework loses credibility.
Common mistakes that make eval look better than reality
- Using only happy-path tests: you get inflated scores and miss costly edge failures.
- Ignoring cohorts: the global score hides who got worse.
- Mixing baseline and candidate conditions: different datasets, prompts, or judges make comparisons meaningless.
- Tracking output quality without operations: the "better" model may be too expensive or too slow to deploy.
- Confusing fluency with correctness: polished language can mask worse grounding.
- No human calibration: judge-model drift quietly changes what "good" means over time.
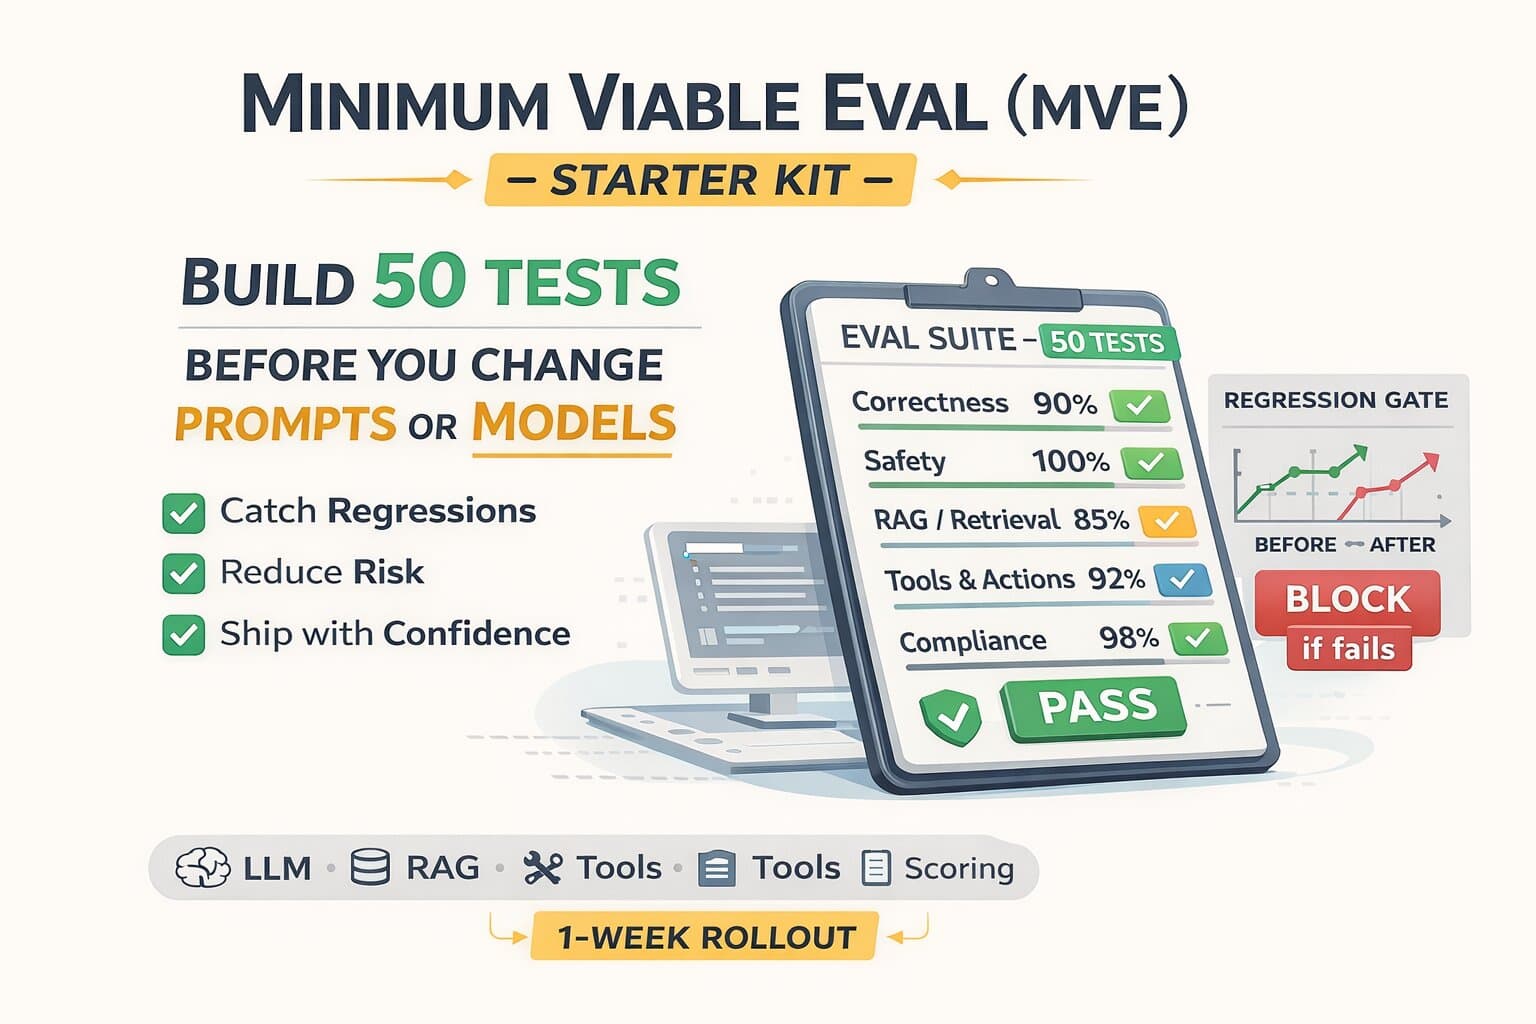
If you want the next step after this framework, build the first versioned test set and release gate. The fastest route is the MVE Starter Kit.
Need a production-grade eval system?
We help teams define scorecards, build eval suites from real logs, and install regression gates so model or prompt changes stop feeling like a gamble. For ongoing governance after rollout, the Reliability Retainer operationalizes the monitoring loop.
FAQ
Questions readers usually ask next
What should we measure before changing a prompt or model?
At minimum: task success, groundedness or citation validity, instruction or schema compliance, safety or policy violations, tool success rate, cost per successful task, P95 latency, and cohort-level regressions. If you measure only one overall quality score, you will miss the most expensive regressions.
Why is task success not enough?
Because a system can complete tasks while still hallucinating, violating format requirements, leaking policy risk, or costing too much to operate. Production evaluation needs multiple lenses because failures happen at different layers.
How do we decide whether to block a release?
Block if critical safety or policy tests fail, if hard constraints like JSON schema or citation requirements break, if key cohorts regress beyond threshold, or if severity-weighted failures worsen meaningfully versus baseline. Warn when regressions are limited and explicitly accepted with mitigations.
What is the best first eval artifact to build?
Start with a small versioned scorecard and a curated test set drawn from production logs. The MVE starter kit is usually the best first artifact because it is fast to build and creates a repeatable baseline before you scale into larger benchmark suites.
The fastest win
Stop debating one aggregate metric. Define a small release scorecard that captures outcome, groundedness, hard constraints, and operations together.
The most common blind spot
Aggregate improvements that hide regressions in high-value or high-risk cohorts.
Need real regression gates?
We help teams turn eval strategy into versioned test sets, release gates, and ongoing monitoring. See the AI Production Audit and the Reliability Retainer.
Last updated
March 9, 2026