The core idea
Performance is speed, scalability is growth behavior, reliability is failure behavior. Separate the axis before you choose the fix.
Scalability, performance, and reliability often get used as if they mean the same thing: "the system feels good." In production, they fail differently, show up in different metrics, and require different fixes. If you don't separate them, teams tend to add capacity when they needed to reduce contention, or chase uptime while tail latency quietly erodes the user experience.
This article is part of the scalable architecture cluster and supports the full pillar: Scalable Architecture (Complete Guide): Patterns, Principles, Design & Examples . If you want the full blueprint and reference architecture, start there.
Why these terms get mixed up
The confusion is understandable: the symptoms overlap. Users report "it's slow," dashboards show "high CPU," and incidents show "timeouts." Those signals can be caused by poor performance, poor scalability, poor reliability, or a mix of all three. The difference is not semantic; it's about what changes the system behavior: request cost (performance), rising demand (scalability), or partial failure (reliability).
A simple mental model is: performance is about speed, scalability is about growth, and reliability is about failure. The sections below keep it practical, with the production signatures that distinguish them.
Performance: how fast is one request?
Performance answers a narrow question: how fast does a request complete under a given load and environment? In practice, the only numbers that survive contact with reality are tail percentiles and the resource cost to achieve them.
What to measure
- P95/P99 latency (averages hide the customer experience)
- Throughput at the current load
- Cost per request (CPU, memory, IO, downstream calls)
Example
"At 100 RPS, the API returns P99 ≈ 80ms." That is a performance statement at that load. It doesn't tell you what happens at 10x traffic, or what happens when a dependency slows down.
Common failure signature
- Time concentrates in one place (a DB query, serialization, a hot lock, an external call)
- Tail latency worsens even when average looks stable
- Resource cost per request creeps upward (efficiency regressions)
Scalability: what happens when load grows?
Scalability answers: as demand increases (traffic, data volume, fanout), does the system degrade in a controlled way, or does it cross a threshold and collapse? A scalable system can get slower at higher load and still be scalable, as long as the behavior remains bounded and predictable.
What to measure
- Latency vs load curves (look for thresholds and non-linear jumps)
- Saturation (CPU, memory, IO, thread pools, connection pools)
- Queue depth and backlog (is work accumulating faster than it drains?)
Example
100 RPS → P99 80ms. 1,000 RPS → P99 180ms. 5,000 RPS → P99 350ms. If errors stay controlled and backlogs remain bounded, that's a system scaling. If the same load increase produces timeouts, runaway queues, and retry amplification, that's a scalability failure.
Common failure signature
- Shared bottlenecks (single DB primary, single shard, centralized lock, hot partition)
- Adding instances stops helping (the constraint is elsewhere)
- Overload turns into collapse (backpressure missing, concurrency unbounded)
Reliability: what happens when things fail?
Reliability answers: when components fail or degrade, does the system continue to deliver correct service within your availability and error targets? This is where fault isolation and blast radius control matter more than raw speed.
What to measure
- Error rate and availability vs SLOs
- Failure propagation (does one dependency consume all upstream capacity?)
- Degraded mode behavior (fallbacks, partial responses, load shedding)
Example
A downstream dependency slows. Timeouts and circuit breakers prevent thread pool exhaustion. The system returns a reduced response for non-critical features instead of timing out everything. Users may see less functionality, but they can still complete the core journey.
Common failure signature
- Retry storms and request amplification
- Missing/incorrect timeouts → saturation → cascading failure
- Poor isolation (one tenant/workload degrades others)
Side-by-side scenarios: same system, different diagnosis
These quick scenarios help distinguish the axis you're actually dealing with.
- "P99 is 30ms at 50 RPS." Performance claim only. Scalability and reliability are still unknown.
- "At 10x traffic, P99 jumps to seconds." Scalability failure (usually a shared constraint or missing backpressure).
- "No errors during an incident, but P99 is awful." Reliability may be acceptable; performance under degraded conditions is not.
- "A small dependency hiccup triggers widespread timeouts." Reliability failure (cascading and amplification).
Common misconceptions (and the production consequence)
- "Scaling out improves performance." Only if the bottleneck is in the tier you're scaling. If the constraint is DB/lock/downstream, scaling app nodes increases contention and can worsen tails.
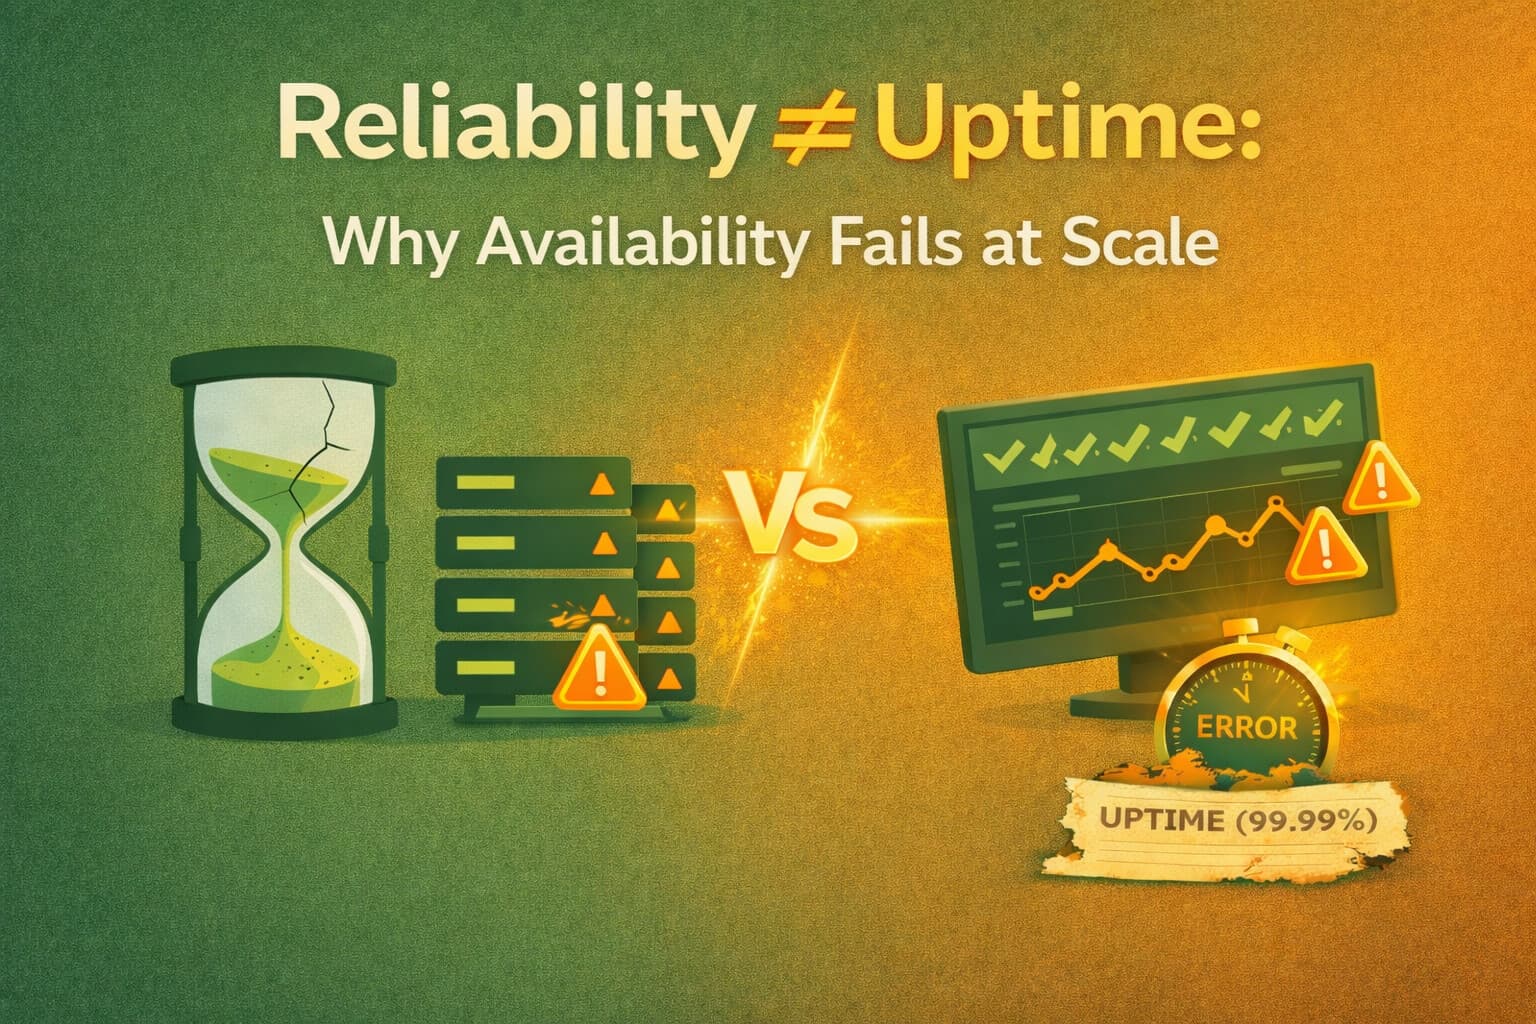
- "If it's reliable, it's good enough." High uptime with bad P99 still loses users and revenue. Availability metrics can look fine while the customer experience degrades.
- "Microservices automatically scale." They can improve isolation, but also increase call graph depth and tail latency if fanout and dependencies aren't controlled.
A practical decision flow: what are you actually fixing?
Instead of debating terminology, use a short diagnostic flow. The goal is to choose the right kind of work before you start "optimizing."
- Where is the time spent on the request path? If one step dominates (query, lock, external call), you're in performance work.
- How does behavior change as load increases? If you see thresholds (non-linear P99, backlog growth, saturation), you're in scalability work.
- What happens when a dependency fails or slows? If failure propagates or retries amplify traffic, you're in reliability work.
In mature systems, these axes are connected, but they are not interchangeable. Fixing the wrong axis is how teams burn quarters without changing the production outcome.
What to read next
If you want to go deeper, the next articles in this cluster focus on the parts that usually break first: tail latency, bottleneck isolation, and validation under real load.
Continue the cluster
Start with the pillar: Scalable Architecture (Complete Guide) . Then, if you're debugging production behavior, read: Architecture Scalability: What Actually Breaks First at 10x Traffic .
Final takeaway
Performance is about request speed. Scalability is about behavior under growth. Reliability is about behavior under failure. Keep them separate in your diagnosis, pick metrics that reflect reality (tails, saturation, propagation), and you'll choose fixes that move the production outcome rather than just the architecture diagram.
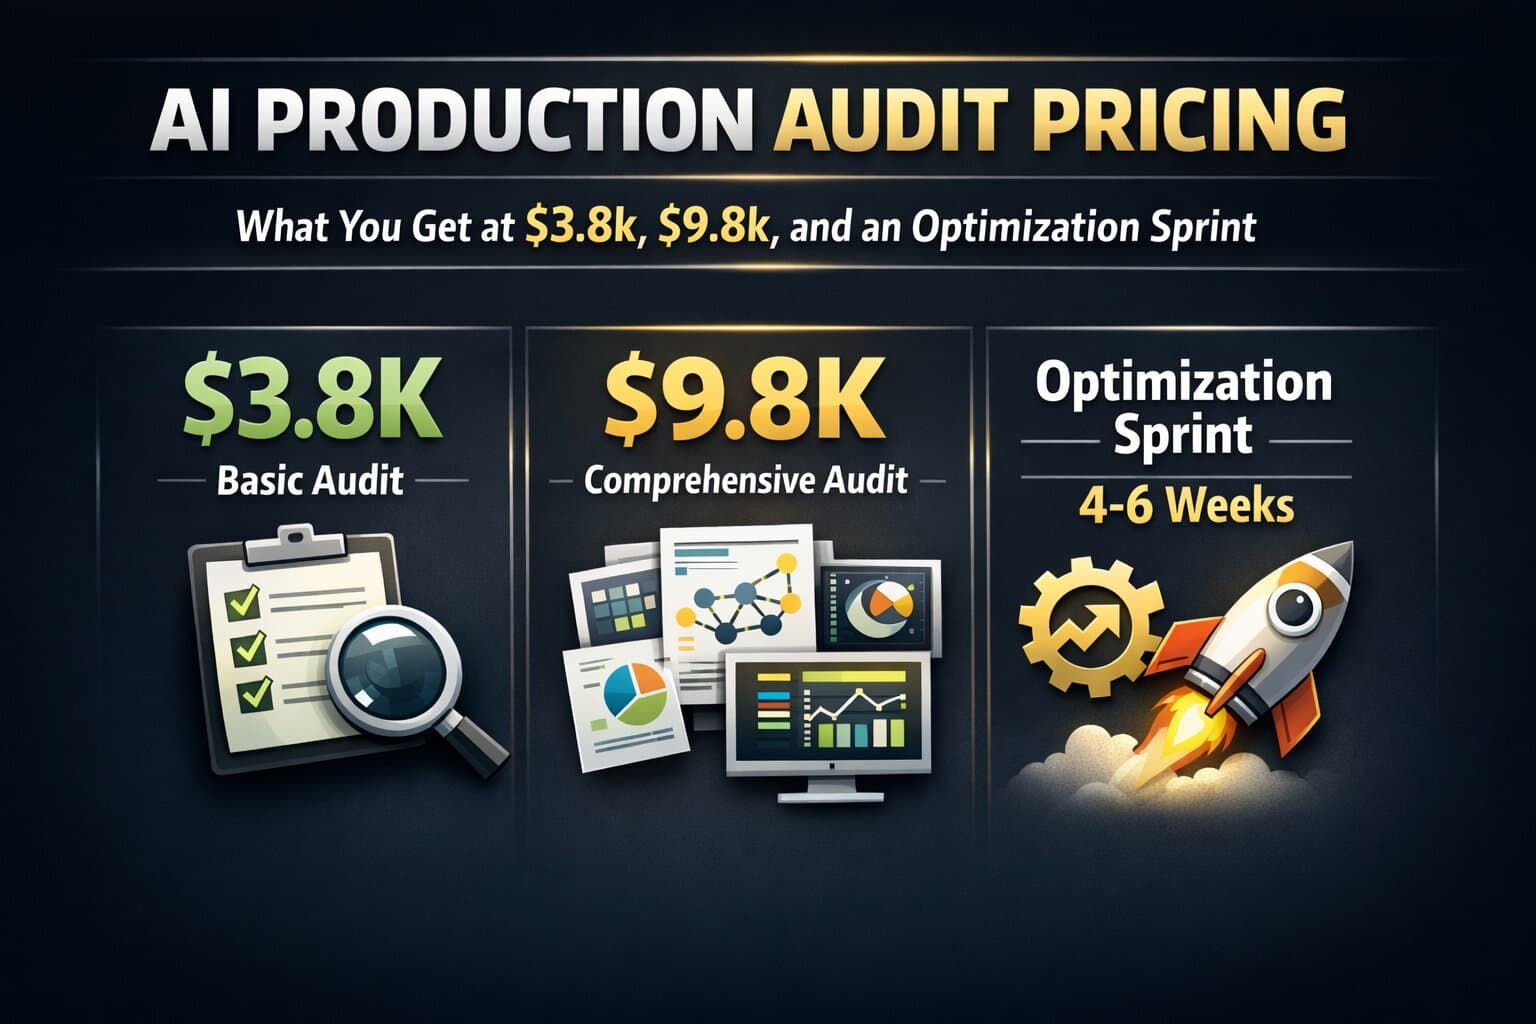
If your system is "scalable on paper" but unpredictable in production, a baseline audit can identify the real constraint end-to-end and quantify impact using P95/P99 and SLOs. Get an AI system audit .
What breaks first
Usually not "capacity." It's tails, saturation thresholds, and failure propagation that turns slowness into incidents.
What to measure
Tails (P95/P99), saturation (pools/queues), and propagation signals (timeouts, retries, breakers).
Want a clear diagnosis?
If your architecture debates aren't changing production outcomes, start with an evidence-based baseline. Get an AI system audit.
Last updated
January 8, 2026