The core idea
Stop thinking "cost per request." Use cost per successful task. Break spend into 4 buckets—base generation, context bloat, retries/timeouts, tool loops—and fix the biggest first.
If your OpenAI bill is climbing and nobody can explain why, you don't need a brainstorm. You need a token spend decomposition—and you can run one in 45 minutes.
Most teams track cost "per request" and miss what's actually driving spend: silent retries and timeout storms, tool/agent loops, context bloat (system prompt + chat history + RAG chunks), and routing mistakes (expensive models used for easy intents). The invoice total tells you nothing. The buckets tell you everything.
This guide walks you through a timeboxed 45-minute audit that works even without perfect observability. By the end, you'll know where your spend comes from, which 2–3 fixes will cut cost fastest without killing quality, and what to instrument next for a full AI system audit.
Context
Part of the LLM Audit hub: LLM Production Audit Framework. See also: Reduce OpenAI Bill Without Hurting Quality, LLM Cost Optimization Service (what we actually change), Audit Readiness (minimum logging schema), Do You Need an LLM Audit?, RAG Wrong Answers Triage.
What you need before you start (minimum inputs)
You don't need perfect data. You need enough to decompose. You can run this audit with any of the following:
Option A (best): request-level logs
For each request (or conversation turn), you have: model name, input tokens, output tokens, timestamp, endpoint/product surface (chat, agent, API), status (success/fail/timeout), retries count (or infer from repeated request IDs).
Option B: provider usage exports + partial app logs
You can still do this if you have: OpenAI usage export (by model/day), approximate request volume and latency/timeout logs.
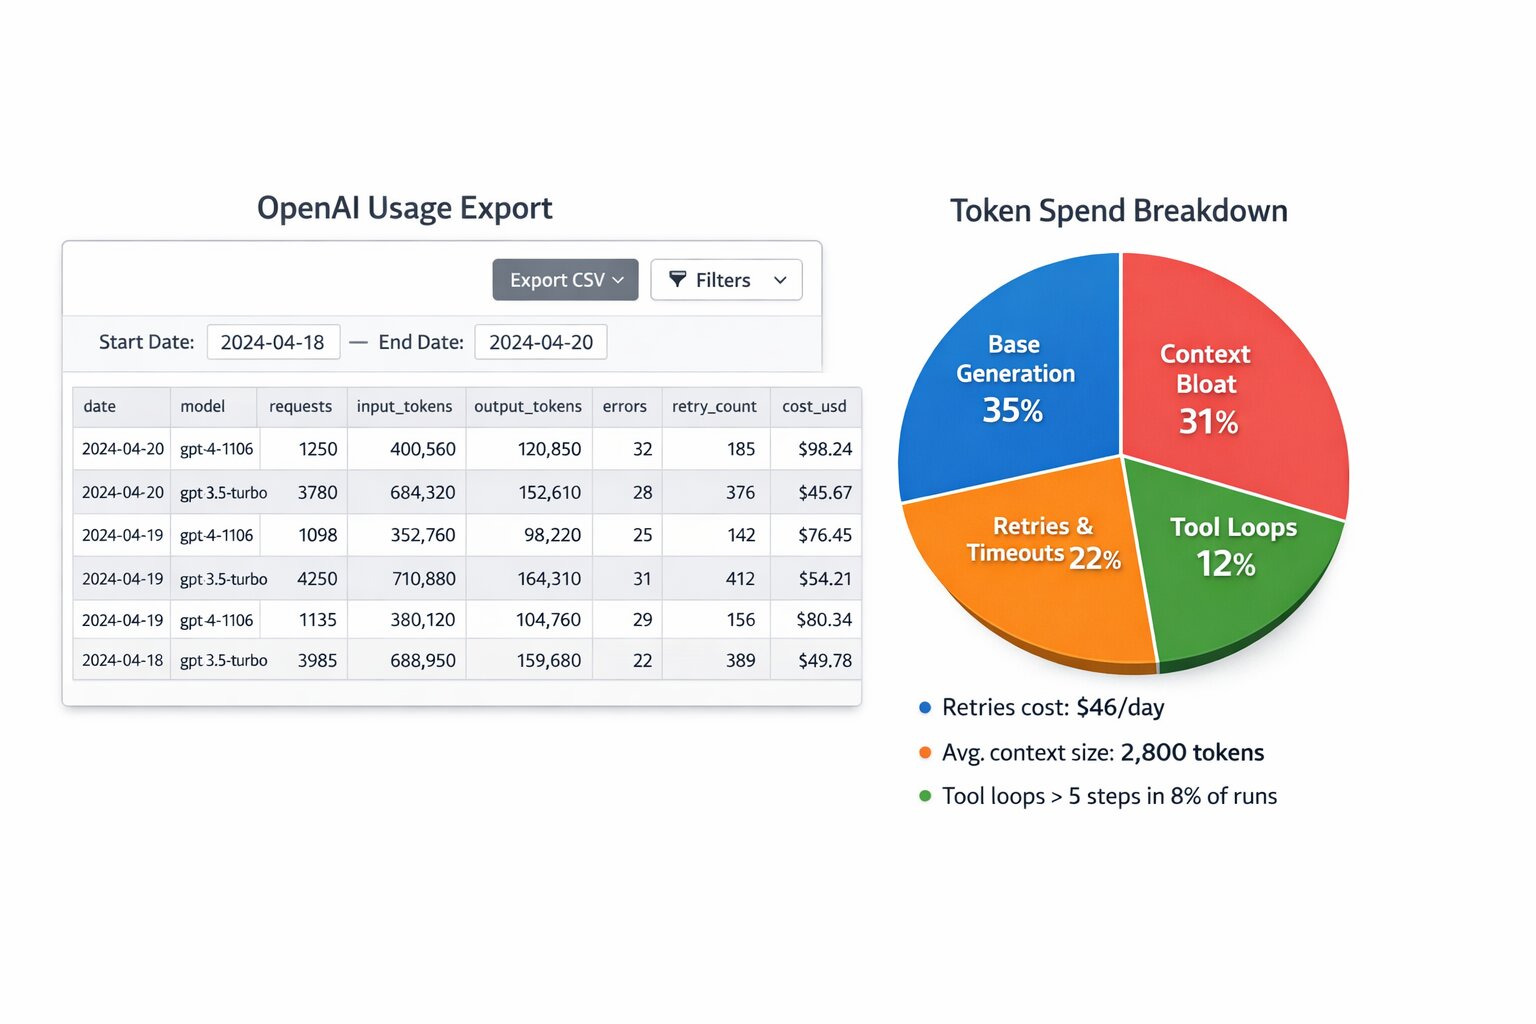
OpenAI Usage Export walkthrough
If you're on Option B, use the usage dashboard and export to feed the 4-bucket breakdown. One or two screenshots (data blurred) make the audit concrete and keep readers on the page longer.
- Usage dashboard (by model/day) — In the OpenAI usage dashboard, filter by date range and break down by model. You get cost and token volume per model per day; that's your first cut for "which model is eating spend."
- Export CSV columns — When you export usage, the CSV typically includes: date, model, input_tokens, output_tokens, and cost. Map these to the buckets: base generation from input+output; if you have timestamps and request counts, correlate spikes with retries/timeouts from your app logs.
- Example: spend spikes = retry storm — When cost and token volume spike in a short window (e.g. 10–30 minutes) while success rate drops, that's often a retry storm or timeout cascade. Overlay usage export (cost by hour) with your error/retry metrics to confirm.
Option C: "good enough" estimate
Even with only: daily cost by model, request/day—you can identify the biggest driver categories, just with less precision.
Minimum schema (logging) — copy/paste
Devs can implement this and run the audit immediately. Minimum fields to log per request:
| Field | Purpose |
|---|---|
| request_id | Dedupe retries, trace chain |
| session_id | Cohort by user/session |
| model | Cost attribution by model |
| endpoint / surface | Chat vs agent vs API |
| input_tokens, output_tokens | Spend decomposition |
| system / history / rag / tool token estimates | Context bloat breakdown |
| status, error_type, retry_count | Retry & timeout waste |
| tool_calls_count, agent_steps | Tool/agent loop detection |
{
  "request_id": "req_abc123",
  "session_id": "sess_xyz",
  "model": "gpt-4.1-mini",
  "surface": "chat",
  "input_tokens": 1200,
  "output_tokens": 180,
  "tokens_system": 400,
  "tokens_history": 300,
  "tokens_rag": 450,
  "tokens_tool": 50,
  "status": "success",
  "retry_count": 0,
  "tool_calls_count": 2,
  "agent_steps": 3
}
Rule: You don't need perfect data to find 80% of the waste. You need decomposition.
The 45-minute audit plan (timeboxed)
Stick to the timebox. The goal is a usable spend pie and a prioritized fix list—not perfection. Each step builds on the last.
Minute 0–5: Define the unit you care about
Stop thinking "cost per request." Start with cost per successful task—the only metric that ties spend to outcomes.
A "task" is the user outcome you care about: "answered correctly with grounded citations," "ticket classified correctly," "tool action executed successfully," "agent completed workflow without escalation."
If you don't have "success" labels yet, use a proxy: no fallback triggered, no user re-ask within 2 turns, no "I don't know" or apology loops, no tool failure. You can refine this later, but don't skip it.
Cost per successful task (CPS)
CPS = total_tokens_spent / successful_tasks
Success proxy rules (when you don't have labels yet):
- No re-ask in 2 turns
- No fallback triggered
- Tool succeeded (no tool failure)
Success proxy pitfalls:
- Re-ask doesn't always mean fail—user might clarify; don't over-count failures.
- Fallback to a bigger model can still be "success" if the answer was correct.
- Multiple tool calls aren't failure if the workflow completed; watch for loops, not count.
Minute 5–15: Break spend into 4 buckets (the spend pie)
This is the core of the audit. Create these four buckets and assign every token to one of them:
- Base generation tokens — normal prompt + normal output
- Context bloat tokens — system prompt + history + RAG context inflation
- Retries & timeouts waste — failed calls, retry storms, partial responses
- Tool/agent loops waste — unnecessary steps, repeated tool calls, looping
You're trying to answer: Which bucket is the biggest? That determines your fix order.
Example spend pie (toy numbers)
- Base gen 38%
- Context bloat 34%
- Retries 18%
- Tool loops 10%
Interpretation: Context bloat is almost as big as base gen—cap system + history + RAG first. Retries at 18% mean you have real waste from timeouts/retries; fix idempotency and backoff before chasing tool loops. If your pie looks like this, start with context budgets and retry caps.
Minute 15–25: Token spend decomposition (per request)
For a sample of ~200–500 requests (or 1–2 hours of traffic), compute:
A) Input token composition
Split input tokens into: system prompt tokens, conversation history tokens, RAG context tokens, tool traces/tool outputs tokens (if included in prompt), user message tokens.
If you don't log these separately, estimate: system prompt = constant; history = prompt length minus system minus current user minus retrieved chunks; RAG = retrieved chunk token counts or rough average.
B) Output tokens
Just total output tokens per request.
C) Wasted tokens (retries/timeouts)
For each request: total tokens spent on failed attempts (timeouts, 5xx, cancellation); tokens spent on retries that didn't improve outcome. If you don't have explicit retry counts, infer from repeated requests within a short window, spike in timeout errors, long latency tails correlated with cost spikes.
Minute 25–35: Find the "silent spenders" (top 6 patterns)
Sort by: highest cost per request, highest input tokens, highest retries/timeouts, highest tool call counts, highest loop counts (agent steps). These six patterns show up in almost every audit:
- Context bloat (most common) — input tokens trending up week-over-week; "helpful" additions to system prompt never removed; chat history appended without budget; RAG returns too many chunks everywhere.
- Retry storms at peak hours — p95 latency spikes and cost spikes together; timeouts rise; retries amplify spend; success rate drops while cost rises.
- Tool loops / agent loops — same tool called multiple times per request; "search → summarize → search again" loops; tool output pasted back into prompt repeatedly.
- Model misrouting — expensive model used for low-risk/low-complexity intents; no fallback logic; no "fast model first" policy.
- Unbounded RAG retrieval — high k and reranking always-on; rerank costs large share of spend; longer contexts causing worse quality (confusion). Unbounded RAG = wrong answers + higher cost. For RAG context bloat debugging, see our RAG Wrong Answers Triage.
- Over-generation — output tokens inflated by verbose answers; no max tokens / stop rules by intent; no structured output constraints.
Minute 35–40: Segment by cohort (where the money leaks)
Averages hide everything. Break the spend by: intent category, language, tenant/customer tier, product surface (chat vs agent), time of day (peak vs off-peak). One cohort often drives most of the waste.
You're looking for: one intent that is 15% of traffic but 50% of spend; one customer tier with huge context length; one language cohort with more retries/timeouts; one agent workflow with loop storms.
Minute 40–45: Pick the first 3 fixes (best ROI order)
Fix order that usually wins:
- Stop waste: retries/timeouts + loop storms
- Cap context: context budgets + retrieval bounds
- Route smart: model routing + selective reranking
Why this order? Waste fixes cut spend immediately without touching product behavior much. Context caps cut tokens and often improve quality. Routing gives step-function savings once you can validate with evals.
The scorecard you produce (what "done" looks like)
At the end of 45 minutes, you should have a concrete deliverable—not a vague "we'll look into it." Aim for:
- A spend pie chart (4 buckets) — base generation, context bloat, retries/timeouts waste, tool/agent loop waste
- Top 10 worst cohorts by cost per successful task (even if "success" is a proxy for now)
- Top 5 "silent spender" patterns with evidence (e.g., "Retries account for 22% of spend between 9–11am")
- A prioritized fix plan (3 items) — each with expected % cost reduction, risk to quality, how to validate (eval gate)
How to fix each major bucket (quick wins)
Bucket 1: Retries & timeouts waste
Quick wins: implement idempotency keys; apply exponential backoff + max retry caps; route to smaller model on retry for low-risk intents; add circuit breakers around flaky tools; detect "retry storms" and shed load gracefully.
Validation: retry rate down, timeouts down, cost down while success stays stable.
Bucket 2: Tool/agent loops waste
Quick wins: hard cap agent steps by intent (e.g., 3–5); add loop detectors (same tool called twice with similar args); cache tool results within a session; require output validation before repeating tool calls; store intermediate reasoning in short form (don't paste huge tool outputs).
Validation: loop rate down, tool calls per success down, TTFT and total latency improve.
Bucket 3: Context bloat
Quick wins: enforce a token budget for system prompt, history, RAG context; summarize long history instead of appending everything; cap RAG chunk count and total context tokens; dedupe near-duplicate chunks; "stop retrieving when confident" gating.
Validation: input tokens down, groundedness stable or improved, fewer contradictions in context.
Bucket 4: Model misrouting & over-generation
Quick wins: route low-risk intents to a fast/cheap model; only use expensive model for high-risk or low-confidence cases; use structured outputs (schemas) for deterministic tasks; cap verbosity by intent.
Validation: cost down by cohort, eval scores stable, fallback rate acceptable.
Alert thresholds (when to act)
B2B teams pay for clear thresholds. Consider alerting when:
- Retry rate > 2% in a 10-minute window
- p95 latency 2× baseline and cost up in the same window
- Input tokens per request WoW increase > 15%
- Agent steps > 5 in more than 3% of runs
These are starting points—tune by intent and risk. The goal is to catch waste and context bloat before they become bill spikes.
What NOT to do
Cost cuts that don't hurt quality require discipline. Avoid these traps:
- Don't shorten the system prompt blindly. It can reduce quality or break constraints; measure with evals first.
- Don't cap tokens globally. Cap by intent or risk tier—some tasks need more context.
- Don't switch models without an eval gate. Run before/after on a golden set so cost cuts don't break accuracy.
Code snippets (token breakdown, retry storm, tool loop)
Enough for a dev to copy the idea. Token breakdown:
def token_breakdown(request):
    s, h, r, t = request.tokens_system, request.tokens_history, request.tokens_rag, request.tokens_tool
    return {
        "system": s, "history": h, "rag": r, "tool": t,
        "user": request.input_tokens - (s + h + r + t),
    }
Detect retry storm (windowed):
def retry_storm_detected(requests, window_min=10, threshold_pct=0.02):
    retries = sum(1 for r in requests if r.retry_count > 0)
    return (retries / len(requests)) > threshold_pct
Detect tool loop (same tool + args repeated):
def tool_loop_detected(tool_calls):
    seen = set()
    for call in tool_calls:
        key = (call.tool_name, hash(call.args))
        if key in seen:
            return True
        seen.add(key)
    return False
A simple worksheet (copy/paste)
OpenAI Bill Audit (45 min)
Date range: ____
Total spend: ____
Requests: ____
Spend by model: ____
Spend decomposition
Base generation: ___%
Context bloat: ___%
Retries/timeouts waste: ___%
Tool/agent loops waste: ___%
Top cost drivers (evidence)
Worst cohorts — Intent: ____ (cost/success: ____)
Language: ____ (cost/success: ____)
Workflow: ____ (loop rate: ____)
Top 3 fixes
____ (expected impact: __%)
____ (expected impact: __%)
____ (expected impact: __%)
Validation plan
Eval set: ____
Gate thresholds: ____
Monitoring alerts: ____
Want a real cost teardown (with before/after proof)?
Use the worksheet above as a template. For a full audit with before/after proof, share 1–2 days of anonymized request logs (tokens, model, retries, latency) and your main intents. We produce:
- a complete token spend decomposition,
- a fix roadmap ranked by ROI, and
- a validation plan (eval gates + monitoring) so cost reductions don't break quality.
Next step
For a full cost teardown with before/after proof, see our AI System Audit. For cost reduction sprints (routing, context budgets, caching), see AI Optimization Services. For the full framework (guardrails, waste, context, routing), read Reduce OpenAI Bill Without Hurting Quality. To understand what to instrument first, see Audit Readiness.
FAQ
Questions readers usually ask next
What data do I need for a 45-minute OpenAI bill audit?
Best: request-level logs (model, input/output tokens, timestamp, status, retries). Good enough: OpenAI usage export + approximate request volume. Minimum: daily cost by model + requests/day. You don't need perfect data to find 80% of the waste.
What are the 4 spend buckets?
Base generation (normal prompt + output), context bloat (system prompt + history + RAG inflation), retries & timeouts waste, and tool/agent loops waste. Which bucket is biggest determines your fix order.
What's the best fix order for cost reduction?
1) Stop waste: retries/timeouts + loop storms. 2) Cap context: context budgets + retrieval bounds. 3) Route smart: model routing + selective reranking. Waste fixes cut spend immediately; context caps often improve quality; routing gives step-function savings.
Want before/after proof?
Share 1–2 days of anonymized logs—we'll produce a complete token spend decomposition and fix roadmap. See our AI System Audit or AI Optimization Services.
Last updated
March 9, 2026


