Audit vs Monitoring
A reliability audit answers: What fails first? What amplifies it? Which signals predict it early? What changes reduce repeat incidents? Monitoring only tells you if you're unhealthy right now.
A reliability audit is not "set up monitoring." It's not "install an APM." It's not a compliance checklist.
A reliability audit exists to answer one question:
Where will this system fail — and can we see it early enough to stop it from becoming user impact?
If you're searching for a reliability assessment or SRE assessment, you're usually in one of these situations:
- dashboards are green, but customers report broken flows
- incidents repeat and feel non-deterministic
- reliability depends on heroics
- every launch is stressful
- you're approaching a growth event (campaign, new region, peak season)
This article explains what we actually measure (and what we intentionally ignore).
Audit ≠ monitoring ≠ checklist
Monitoring
Monitoring answers: "Are we unhealthy?" It's essential, but it often fails at the exact moment you need it most:
- partial outages
- tail latency blow-ups
- retry amplification
- saturation in pools/queues (while CPU looks "fine")
Checklist
Checklists answer: "Did we do the standard things?" But reliability is not standardized across systems. Failure modes are architecture-specific.
Reliability audit
A reliability audit answers:
- What fails first?
- What amplifies it into an incident?
- Which signals predict it early?
- What changes reduce repeat incidents with the least risk?
Recommended Reading
Understanding the difference between monitoring and auditing: Performance Audit vs Monitoring: What's the Difference? .
What we measure in a real reliability audit
1) Flow-level SLIs (user outcomes)
Reliability is not "the system is up." It's "users can complete the journey."
We measure:
- success rate on critical flows (checkout/login/write path)
- tail latency (P95/P99) on those flows
- correctness signals where 200 OK can still be broken
Why: Most incidents are partial failures. Flow SLIs are how you detect partial failure early.
2) Error budgets + burn rates (decision signals)
A reliability program without budgets is just hope.
We measure:
- whether SLOs exist (and whether they're usable)
- current budget consumption
- burn rate over multiple windows (fast + slow)
Why: burn rates tell you urgency:
- "we're fine"
- "we're drifting"
- "we're going to have an incident today if nothing changes"
3) Tail behavior + saturation (the failure edge)
Incidents live at the tail:
- high concurrency
- contention
- queueing delay
- pooled resource exhaustion
We measure signals that explain tail expansion:
- queue depth / backlog growth
- request time spent waiting vs working (where possible)
- pool utilization (DB connections, thread pools, worker pools)
- dependency timeouts + retry volume
- DB contention/locks, slow queries, replication lag
- cache miss spikes + stampede indicators
- "timeout clusters" (same endpoint, same dependency)
Why: CPU and memory being "green" doesn't mean the system is safe. Most outages begin as waiting.
4) Dependency health + amplification loops
Dependencies don't need to be down to break you. They only need to be slow.
We measure:
- timeout rate by dependency
- retry rates (and whether they're safe)
- circuit breaker open rate (if present)
- fanout depth (how many downstream calls per request)
- variance per dependency (which ones inject tail latency)
Why: small slowness becomes large impact when:
- fanout is high,
- retries are aggressive,
- and pools are near saturation.
5) Change correlation (deploys are the #1 incident trigger)
A huge percentage of incidents are change-related. But many teams can't prove it because deploys aren't measurable events.
We measure:
- deploy markers / release annotations
- config change tracking
- feature flag rollout timelines
- correlation of regressions to releases
We also look at:
- change failure rate
- rollback time
- mean time to detection (MTTD) after deploy
Why: If you can't connect incidents to change, you will keep repeating them.
6) Recovery readiness (reliability includes getting back)
A system that fails but recovers fast can be more reliable than a system that "rarely fails" but takes hours to restore.
We measure:
- detection speed (MTTD)
- containment speed
- recovery speed (MTTR)
- runbook quality (actionable, not theoretical)
- backup/restore reality (tested, not promised)
- failover feasibility (if multi-region is claimed)
Why: "We have backups" is not the same as "we can restore under pressure."
7) Signal quality (not volume)
A reliability audit looks at observability, but not as "more telemetry is better."
We measure:
- are alerts aligned to user outcomes?
- is the team drowning in pages?
- do alerts include action context?
- are dashboards truthful (labels/cardinality/naming consistency)?
- do traces cover critical flows end-to-end?
Why: alert noise hides real risk. High-quality signals prevent incidents by surfacing drift early.
What we ignore (on purpose)
A reliability audit is defined as much by what it doesn't do.
We ignore uptime as the primary metric
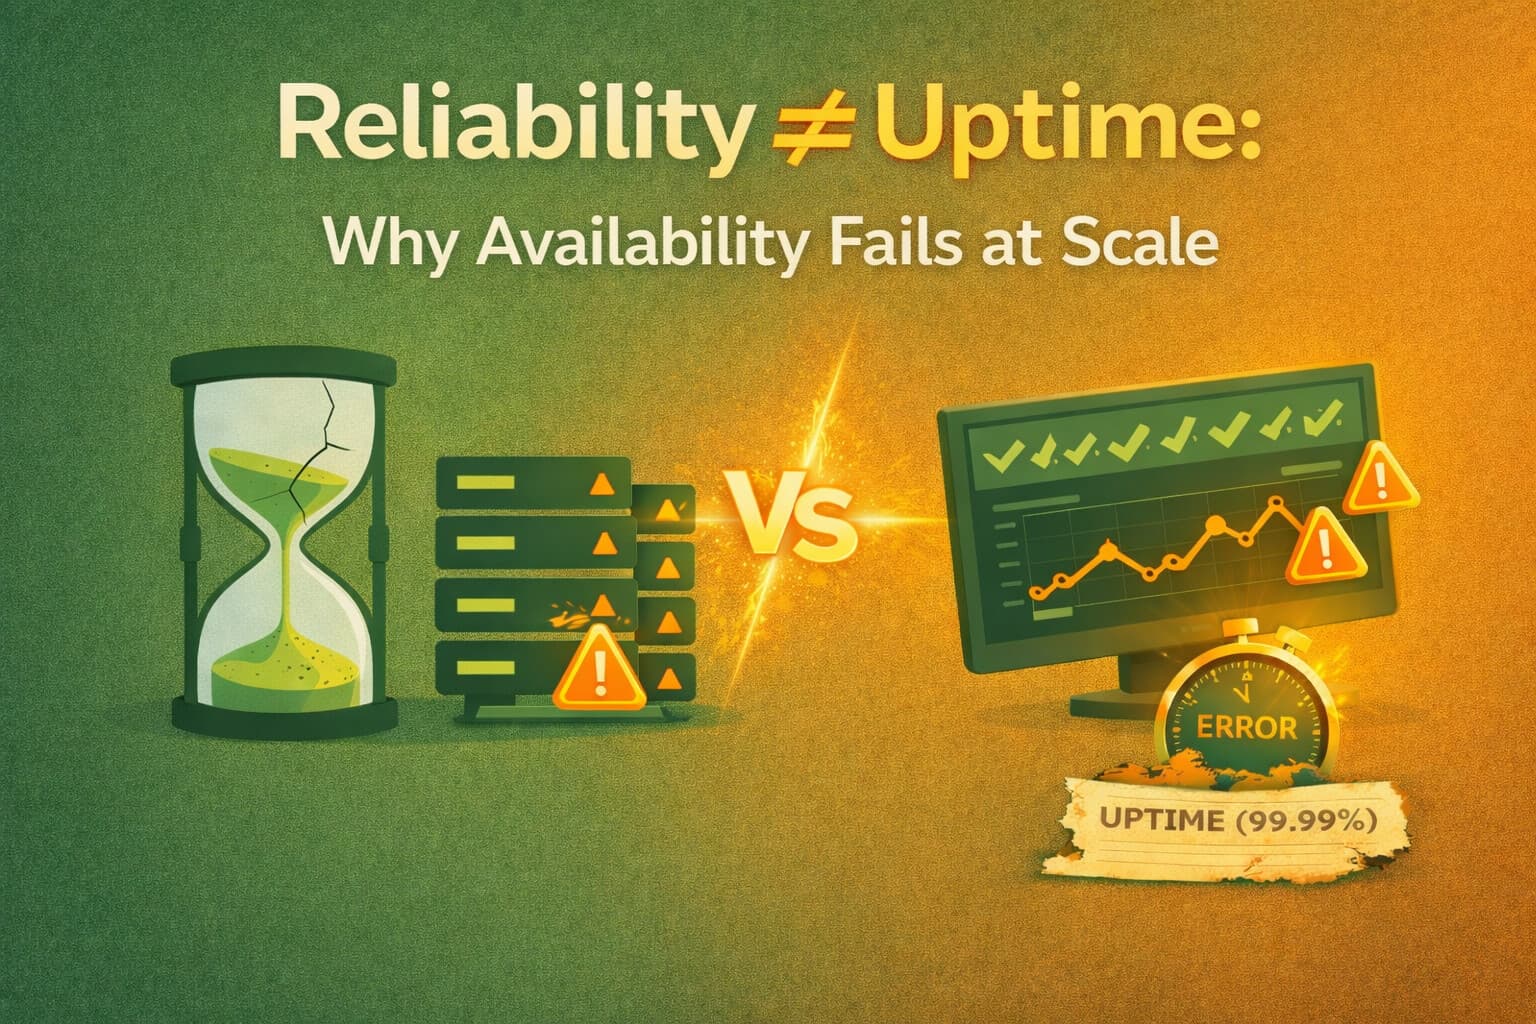
Uptime is binary. Reliability is partial failure, tail latency, and outcomes.
We ignore averages
Average latency can look fine while P99 is unusable.
We ignore "global" percentiles without segmentation
System-wide P95 hides the fact that:
- one endpoint is melting
- one tenant is failing
- one region is degraded
We ignore CPU-only reasoning
CPU "fine" does not mean:
- pools aren't exhausted,
- queues aren't backing up,
- DB isn't locked,
- retries aren't amplifying load.
We ignore "more dashboards" as a deliverable
Dashboards are a tool. The deliverable is:
- failure-mode map
- predictive signals
- fix order with evidence
We ignore checklist compliance as a proxy for reliability
"Best practices" don't prevent architecture-specific failure modes.
Reliability Cluster Context
Understanding why uptime fails at scale: Reliability ≠ Uptime: Why Availability Fails at Scale .
What a good reliability assessment produces (the actual artifacts)
A real audit should leave you with:
- a ranked map of failure modes (what fails first + why)
- the top predictive signals (what to alert on early)
- SLO recommendations (minimal set, flow-aligned)
- error budget policy recommendations (how it changes decisions)
- a prioritized reliability backlog (quick wins + structural fixes)
- rollout guardrails (how to stop regressions becoming incidents)
- a plan to reduce on-call load (signal cleanup + automation)
If you don't get artifacts you can execute, it wasn't an audit. It was a review.
When a reliability audit makes sense
Run a reliability audit when:
- incidents repeat (same class of failure)
- users complain but dashboards look fine
- you're scaling traffic, regions, or services
- you're about to run a major campaign / peak event
- reliability is slowing shipping velocity (fear-driven delivery)
If you want an audit that produces a defensible failure-mode map + predictive signals + a clear fix order, start here.
FAQ
Questions readers usually ask next
What is a reliability audit?
A reliability audit is not monitoring or a checklist. It's a failure-mode map that answers: What fails first? What amplifies it into an incident? Which signals predict it early? What changes reduce repeat incidents with the least risk? The output is a ranked map of failure modes, predictive signals, and a prioritized fix order.
What does a reliability audit measure?
A reliability audit measures: flow-level SLIs (user outcomes), error budgets + burn rates (decision signals), tail behavior + saturation (the failure edge), dependency health + amplification loops, change correlation (deploys are the #1 incident trigger), recovery readiness, and signal quality (not volume).
What does a reliability audit ignore?
A reliability audit intentionally ignores: uptime as the primary metric (reliability is partial failure, not binary), averages (they hide tail pain), global percentiles without segmentation, CPU-only reasoning (pools/queues/locks can saturate while CPU looks fine), 'more dashboards' as a deliverable, and checklist compliance as a proxy for reliability.
When should I run a reliability audit?
Run a reliability audit when: incidents repeat (same class of failure), users complain but dashboards look fine, you're scaling traffic/regions/services, you're about to run a major campaign or peak event, or reliability is slowing shipping velocity (fear-driven delivery).
What We Measure
Flow-level SLIs, error budgets, tail behavior, dependency health, change correlation, recovery readiness, signal quality.
What We Ignore
Uptime as primary metric, averages, global percentiles, CPU-only reasoning, "more dashboards," checklist compliance.
Ready for a Reliability Audit?
If incidents repeat or dashboards are green but users complain, you need a failure-mode map. Request a Reliability Audit.
Last updated
February 2, 2026