The core workflow
Find the constraint end-to-end with a repeatable sequence:metrics → traces → logs. Metrics locate the bending point, traces explain p99, and logs confirm what actually happened.
Observability for scalability is not about collecting more data. It's about finding the real constraint that will break first as load grows—before p99 latency, outages, and cost explode. If you can't see where time and capacity are going, "scaling" becomes pattern shopping and guesswork.
Most teams don't run out of servers. They run out of visibility. Under higher traffic, hidden coupling turns into tail latency, pools exhaust, retries amplify load, and queues accumulate. If your tooling can't answer "what saturates first?" you will scale blind.
Part of the scalable architecture cluster
This article supports the pillar guide: Scalable Architecture (Complete Guide) . If you want the operating model behind the patterns, start there—then use this playbook to diagnose real constraints end-to-end.
Why observability becomes the bottleneck before your system does
At low traffic, broken assumptions can survive. Dependencies are mostly healthy, variance is small, and "slow paths" are rare. At scale, those slow paths become the customer experience, and small failure rates become large incident rates. Without observability, teams default to reactive scaling: add instances, increase DB size, bump limits. It works briefly—until the same constraint reappears under a slightly different shape.
The structural problem is simple: you can't operate what you can't see. A scalable architecture you can't observe becomes unscalable operationally.
Don't ask "Is the system up?" Ask: "If load doubles, what breaks first—and how will it show up?"
Observability for scalability vs monitoring for uptime
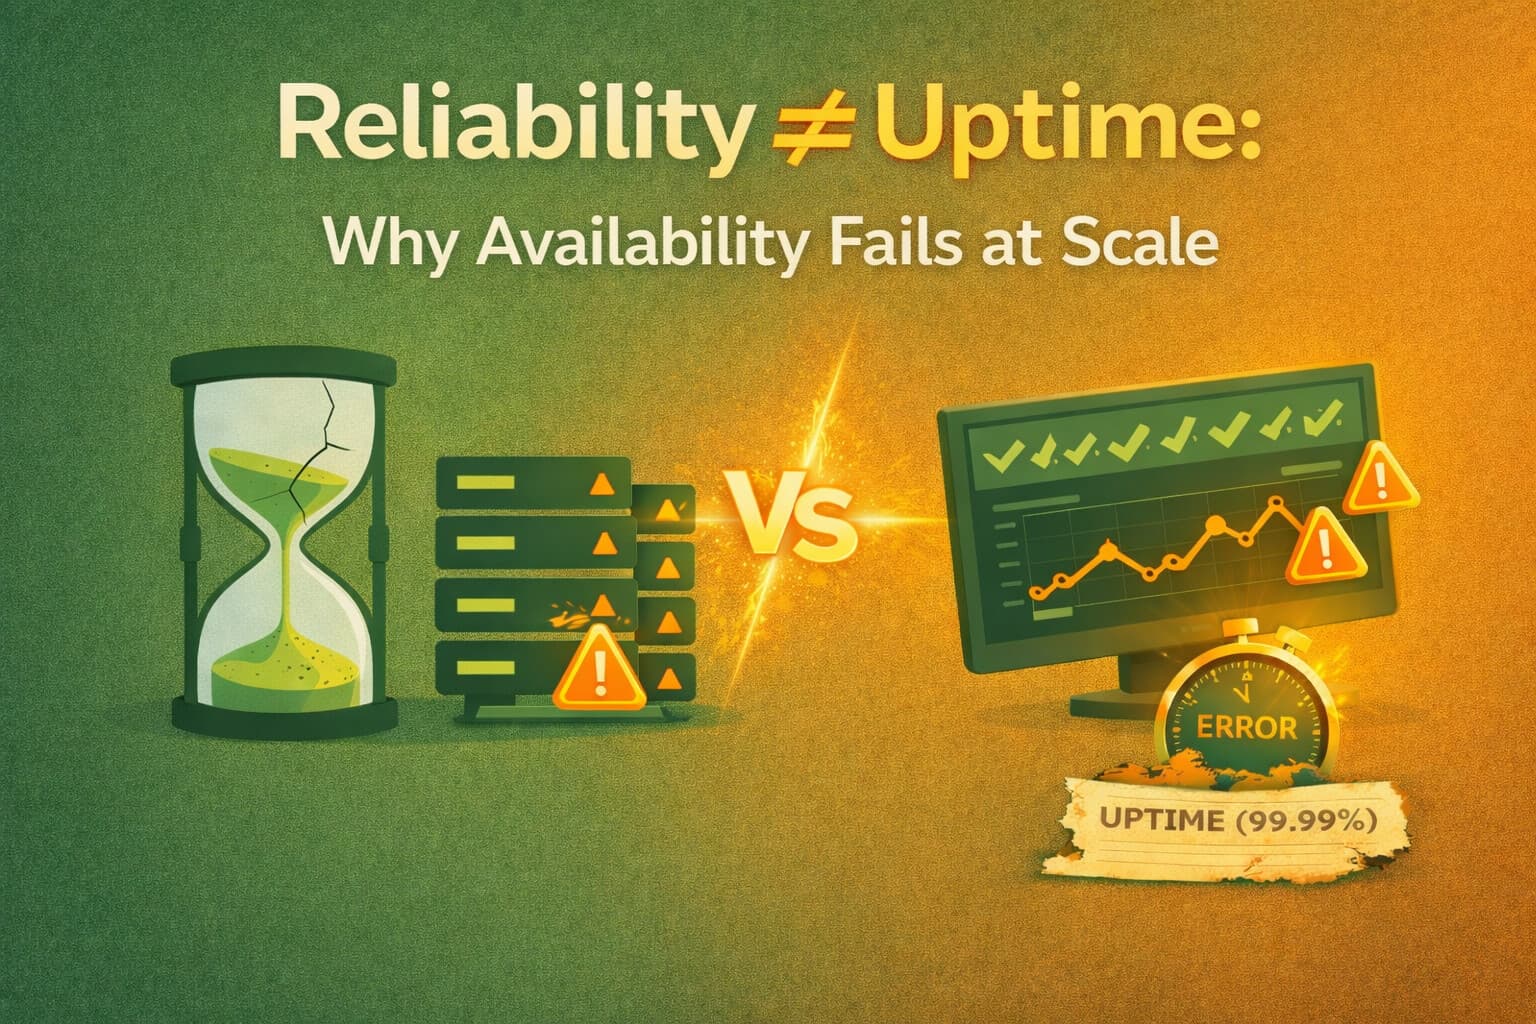
Traditional monitoring is designed for availability: alerts that fire when things are broken. Observability for scalability is designed for constraints: signals that show where growth will fail before it becomes an incident.
- Monitoring mindset: Are services healthy? Did an alert fire?
- Scalability mindset: Where does work accumulate? What saturates first? What amplifies tail latency?
The outcome is different. Monitoring helps you react. Observability helps you prevent.
The three pillars (and why order matters)
The classic pillars still apply, but for scalability the order is critical. Metrics tell you where to look. Traces show you why. Logs confirm what happened. If you start from logs, you drown. If you start from metrics, you converge.
Pillar 1: Metrics (detect where the system bends)
For scalability, metrics should answer: "Where is the constraint forming?" Focus on a small set that reliably predicts incidents under growth:
- Traffic: RPS (by endpoint), concurrency, queue ingress rate
- Latency: p50/p95/p99 (always by endpoint)
- Errors: timeouts, retry rate, dependency error codes
- Saturation: DB pool wait, queue depth/lag, thread exhaustion, I/O wait, GC pauses
Practical rule: if saturation metrics rise, p99 will follow—even when averages look "fine." Saturation is the earliest trustworthy signal of scaling failure.
Pillar 2: Tracing (reveal why p99 explodes)
Tail latency is usually driven by the slowest 1% of requests, and those requests often cross multiple dependencies. Tracing answers: "Which hop dominates the tail?"
- Long synchronous call chains (latency adds up, failures compound)
- Hidden fanout (N calls per request grows under real traffic)
- Retry amplification (retries multiplying load during partial failure)
- Serialization points (locks, hot shards, single-thread workers)
Pillar 3: Logs (verify what happened)
Logs should be structured, correlated (trace_id/request_id/tenant_id), and searchable under pressure. Use logs to confirm hypotheses found via metrics and traces: edge cases, rare failures, and correctness checks.
The constraint-first workflow: metrics → traces → logs
This workflow is designed to converge quickly under real production complexity. It produces a concrete output: a bottleneck map of what limits throughput or p99 latency first.
Step 1: Use metrics to find the bending point
- At what load does p99 start rising non-linearly?
- Which resource saturates first (pool wait, queue lag, I/O wait)?
- Is the problem global or isolated to one endpoint/tenant?
Outcome example: "At ~3k RPS, p99 jumps because DB pool wait time spikes."
Step 2: Use tracing to follow the slow path
- Compare median vs p99 traces (don't debug the average request)
- Identify the span(s) that dominate time in tail requests
- Check for fanout, retries, and hidden synchronous coupling
Outcome example: "Checkout p99 is dominated by synchronous inventory + pricing calls, with retries during partial slowness."
Step 3: Use logs to confirm and segment
- Confirm retries/timeouts/circuit breaker opens
- Segment by tenant_id, key, tier, region
- Validate correctness: idempotency keys, duplicate work, partial writes
Outcome example: "One tenant causes hot-key contention and triggers retry storms."
Step 4: Fix the constraint (then validate before/after)
The goal is not "improve performance." The goal is to remove or control the constraint that makes scalability unstable. Common fixes include: shorten the hot path, introduce backpressure, move work async, fix hot keys, add correct caching, and bound retries. Then load test and confirm the knee moved.
What to measure first (signals that predict scaling failure)
If you're building or repairing observability, prioritize signals that predict p99 and incident rate. These are the measurements that make scaling predictable.
1) Tail latency by endpoint (p95/p99)
Tail latency is the customer experience at scale. Track p95/p99 per endpoint and per critical flow (checkout, auth, publish). If p99 drifts upward over weeks, you have a structural constraint growing.
2) Saturation signals (pools, queues, and "waiting")
- DB connection pool wait time and utilization
- Queue depth / lag and oldest message age
- Thread/worker pool saturation and pending work
- Lock wait time, I/O wait, GC pause time
3) Dependency health + retry rate
Track dependency latency percentiles and errors at the boundary. Add retry rate as a first-class metric. Retries are load multipliers and often turn partial slowness into a full incident.
Tracing at scale: how to find the slowest 1%
Tracing fails when it becomes a checkbox: sampled so heavily that tail requests disappear, or missing correlation so cross-service latency cannot be attributed. For scalability, tracing must surface the slowest requests and their dominant spans.
- Sample intelligently: bias toward slow traces and error traces
- Expose dependency time: DB, cache, HTTP clients, queues
- Mark retries: trace spans should show retry attempts clearly
- Record key dimensions: endpoint, tenant_id, region, tier
A useful practice
Always compare a p50 trace to a p99 trace for the same endpoint. The difference is usually where your scalability work lives: fanout, contention, and slow dependencies.
Logging for verification (not fishing)
Logs should not be your first investigative tool. Use logs to prove what you already suspect from metrics/traces. For scalable operations, logs must be structured and correlated.
- Required fields: trace_id, request_id, tenant_id, user_id (if applicable), endpoint, status, duration
- Dependency context: upstream/downstream IDs, retry count, timeout reason
- Correctness context: idempotency key, dedupe key, event ID
Common observability anti-patterns that fail at scale
- Dashboards full of averages (mean latency looks stable while p99 explodes)
- No saturation metrics (you can't see the constraint forming)
- Traces sampled so aggressively that tail requests disappear
- Logs without correlation IDs (debugging becomes guessing)
- Alerts without a diagnosis path (alert fatigue and slow response)
Reality: tools don't create observability. Intentional questions do. If your telemetry can't answer "what saturates first?", it won't help you scale.
Operational checklist: dashboards, alerts, and runbooks
Observability becomes scalable when it produces consistent behaviors during stress: fast diagnosis and bounded failure. Use this checklist to keep your telemetry operationally meaningful.
Dashboards
- Golden signals per service: traffic, errors, latency percentiles, saturation
- Dependency dashboards at boundaries (client-side metrics matter)
- Queue dashboards: lag, depth, oldest age, DLQ rate
- Per-tenant and per-endpoint slices for skew detection
Alerts
- Alert on p99 + error budget burn (not just CPU)
- Alert on pool wait time and queue lag (early warning)
- Alert on retry rate spikes (amplification detector)
- Use multi-window burn-rate for SLOs to reduce noise
Runbooks
- For each critical alert, document: "what to check first" (metrics → traces → logs)
- Include stop-the-bleeding actions: rate limit, load shed, disable non-critical features
- Define escalation boundaries and ownership per dependency
What to read next
If you're using this workflow to diagnose growth pain, the next step is to apply architectural patterns and guardrails based on what your telemetry reveals: shorten fast paths, add backpressure, and scale data correctly.
Start with: Scalable Architecture (Complete Guide) , then reinforce the operating rules with: Scalable Architecture Principles . If your question is "what breaks first under 10×?", read: Architecture Scalability: What Actually Breaks First .
Final takeaway
Observability for scalability is a production workflow: metrics to locate the constraint, traces to explain tail latency, and logs to confirm. If you can consistently answer "what saturates first?", scaling becomes predictable—and architecture becomes an engineering decision, not a debate.
If your system is already showing early signs—p99 creep, saturation spikes, retry amplification, or "random" slowness— the fastest path to clarity is an evidence-based baseline and a bottleneck map. Get an AI system audit .
What to watch first
Tail latency (p95/p99), saturation (pools, queues, I/O), and retry rate. These predict incidents earlier than CPU.
What "good" looks like
You can name the top constraint under peak load, trace the slowest 1% to a dominant span, and validate before/after fixes.
Want a bottleneck map?
If p99 creep, saturation spikes, or retries are making the system unpredictable, start with a baseline audit. We map tail latency drivers, saturation points, and the top constraint end-to-end. Get an AI system audit.
Last updated
January 14, 2026